Hema.to

Reclaim time for expert work

From raw FCS file to finalized report, AI-powered CellStudio streamlines your workflow. Built for cytometrists and hematologists, CellStudio keeps you in control at every step.

One workflow from cytometer to finalized report.

  1. Cytometry data is uploaded automatically

    CellStudio Connect automatically picks up FCS/LMD files from your flow cytometer and uploads them to the hema.to cloud, fully anonymized.

    Flow cytometer

    Measures FCS/LMD data

    CellStudio Connect

    Anonymizes and uploads the data

    Laboratory

    hema.to cloud

    Securely stores and analyzes the data

    hema.to cloud
  2. Uploaded data is analyzed

    AI predictions

    Automated
    A cell type is predicted for every event, from 20+ supported cell types, independent of panel, SOP or device.
    You control
    All predictions are visible and editable. See all available manual data analysis tools.
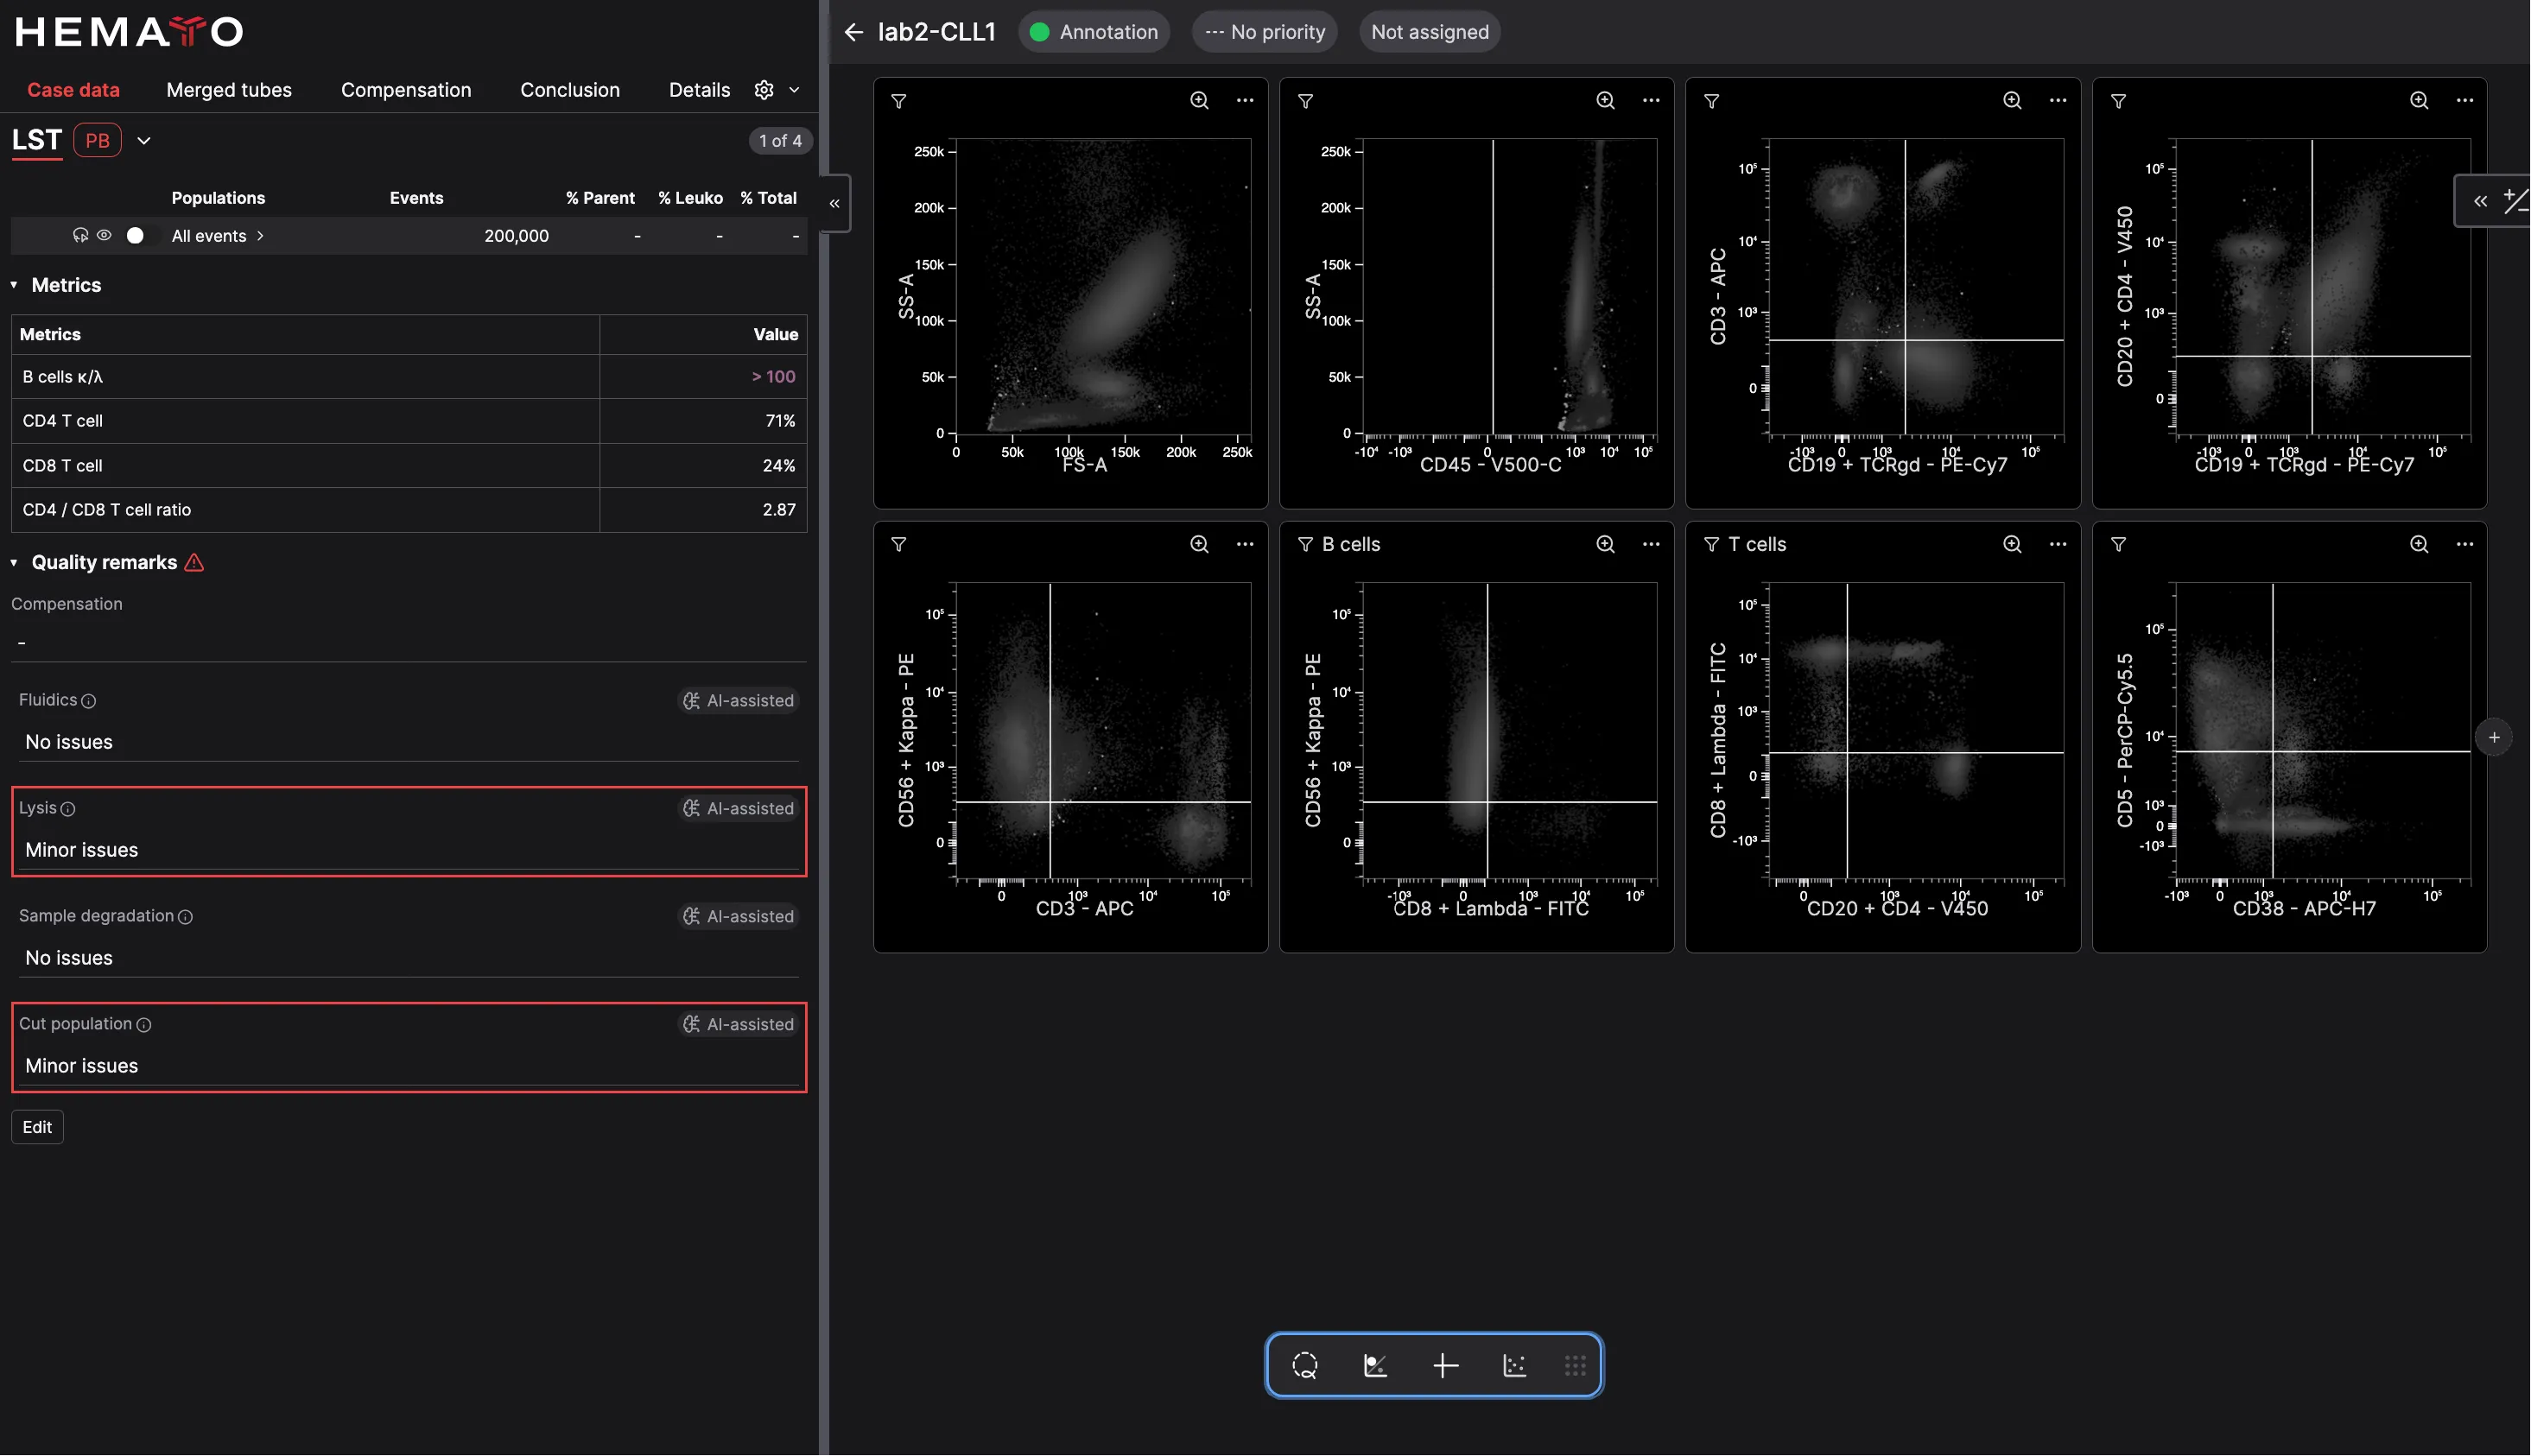
    CellStudio case with AI-predicted cell populations shown in color
    CellStudio case with grayscale scatter plots before predictions
    BeforeAfter

    Phenotype derivation

    Automated
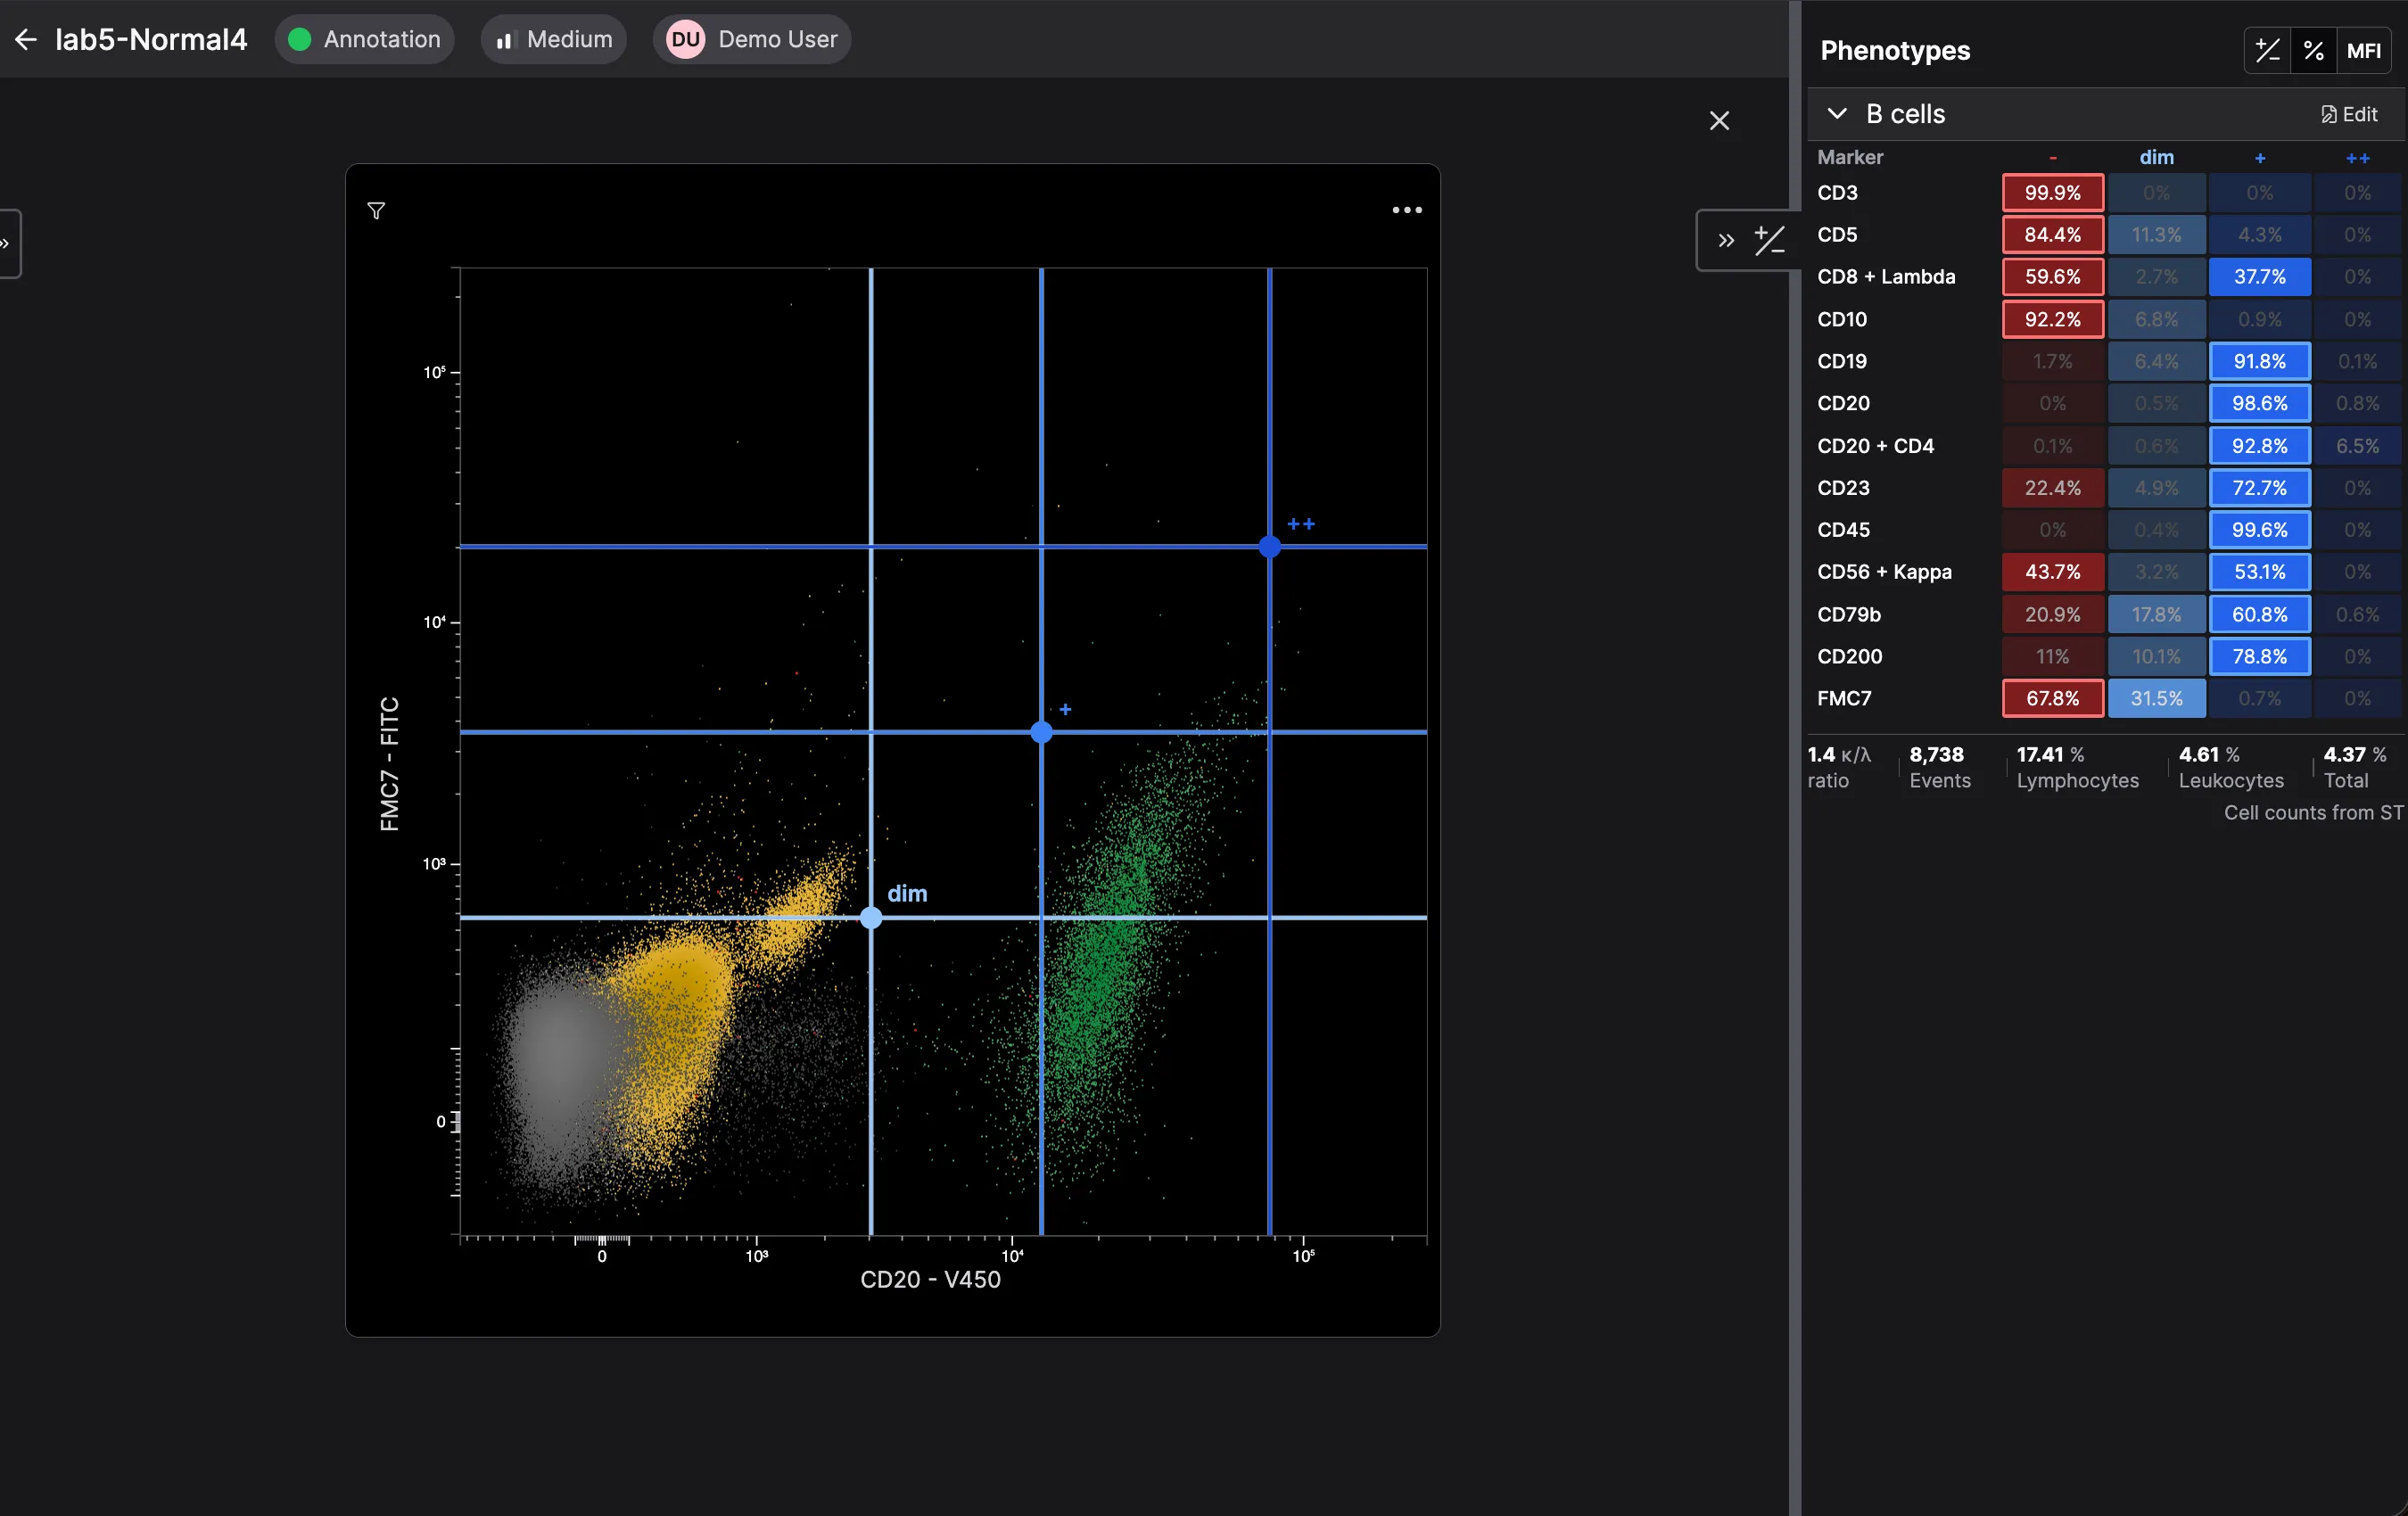
    CellStudio allows thresholding of expression levels to automatically derive fine-grained population phenotypes. Thresholds are set automatically, based on your initial user input.
    You control
    All thresholds are visible and editable. You can track one (or many) populations across tubes and derive a richer phenotype, automatically making it available in your reports.
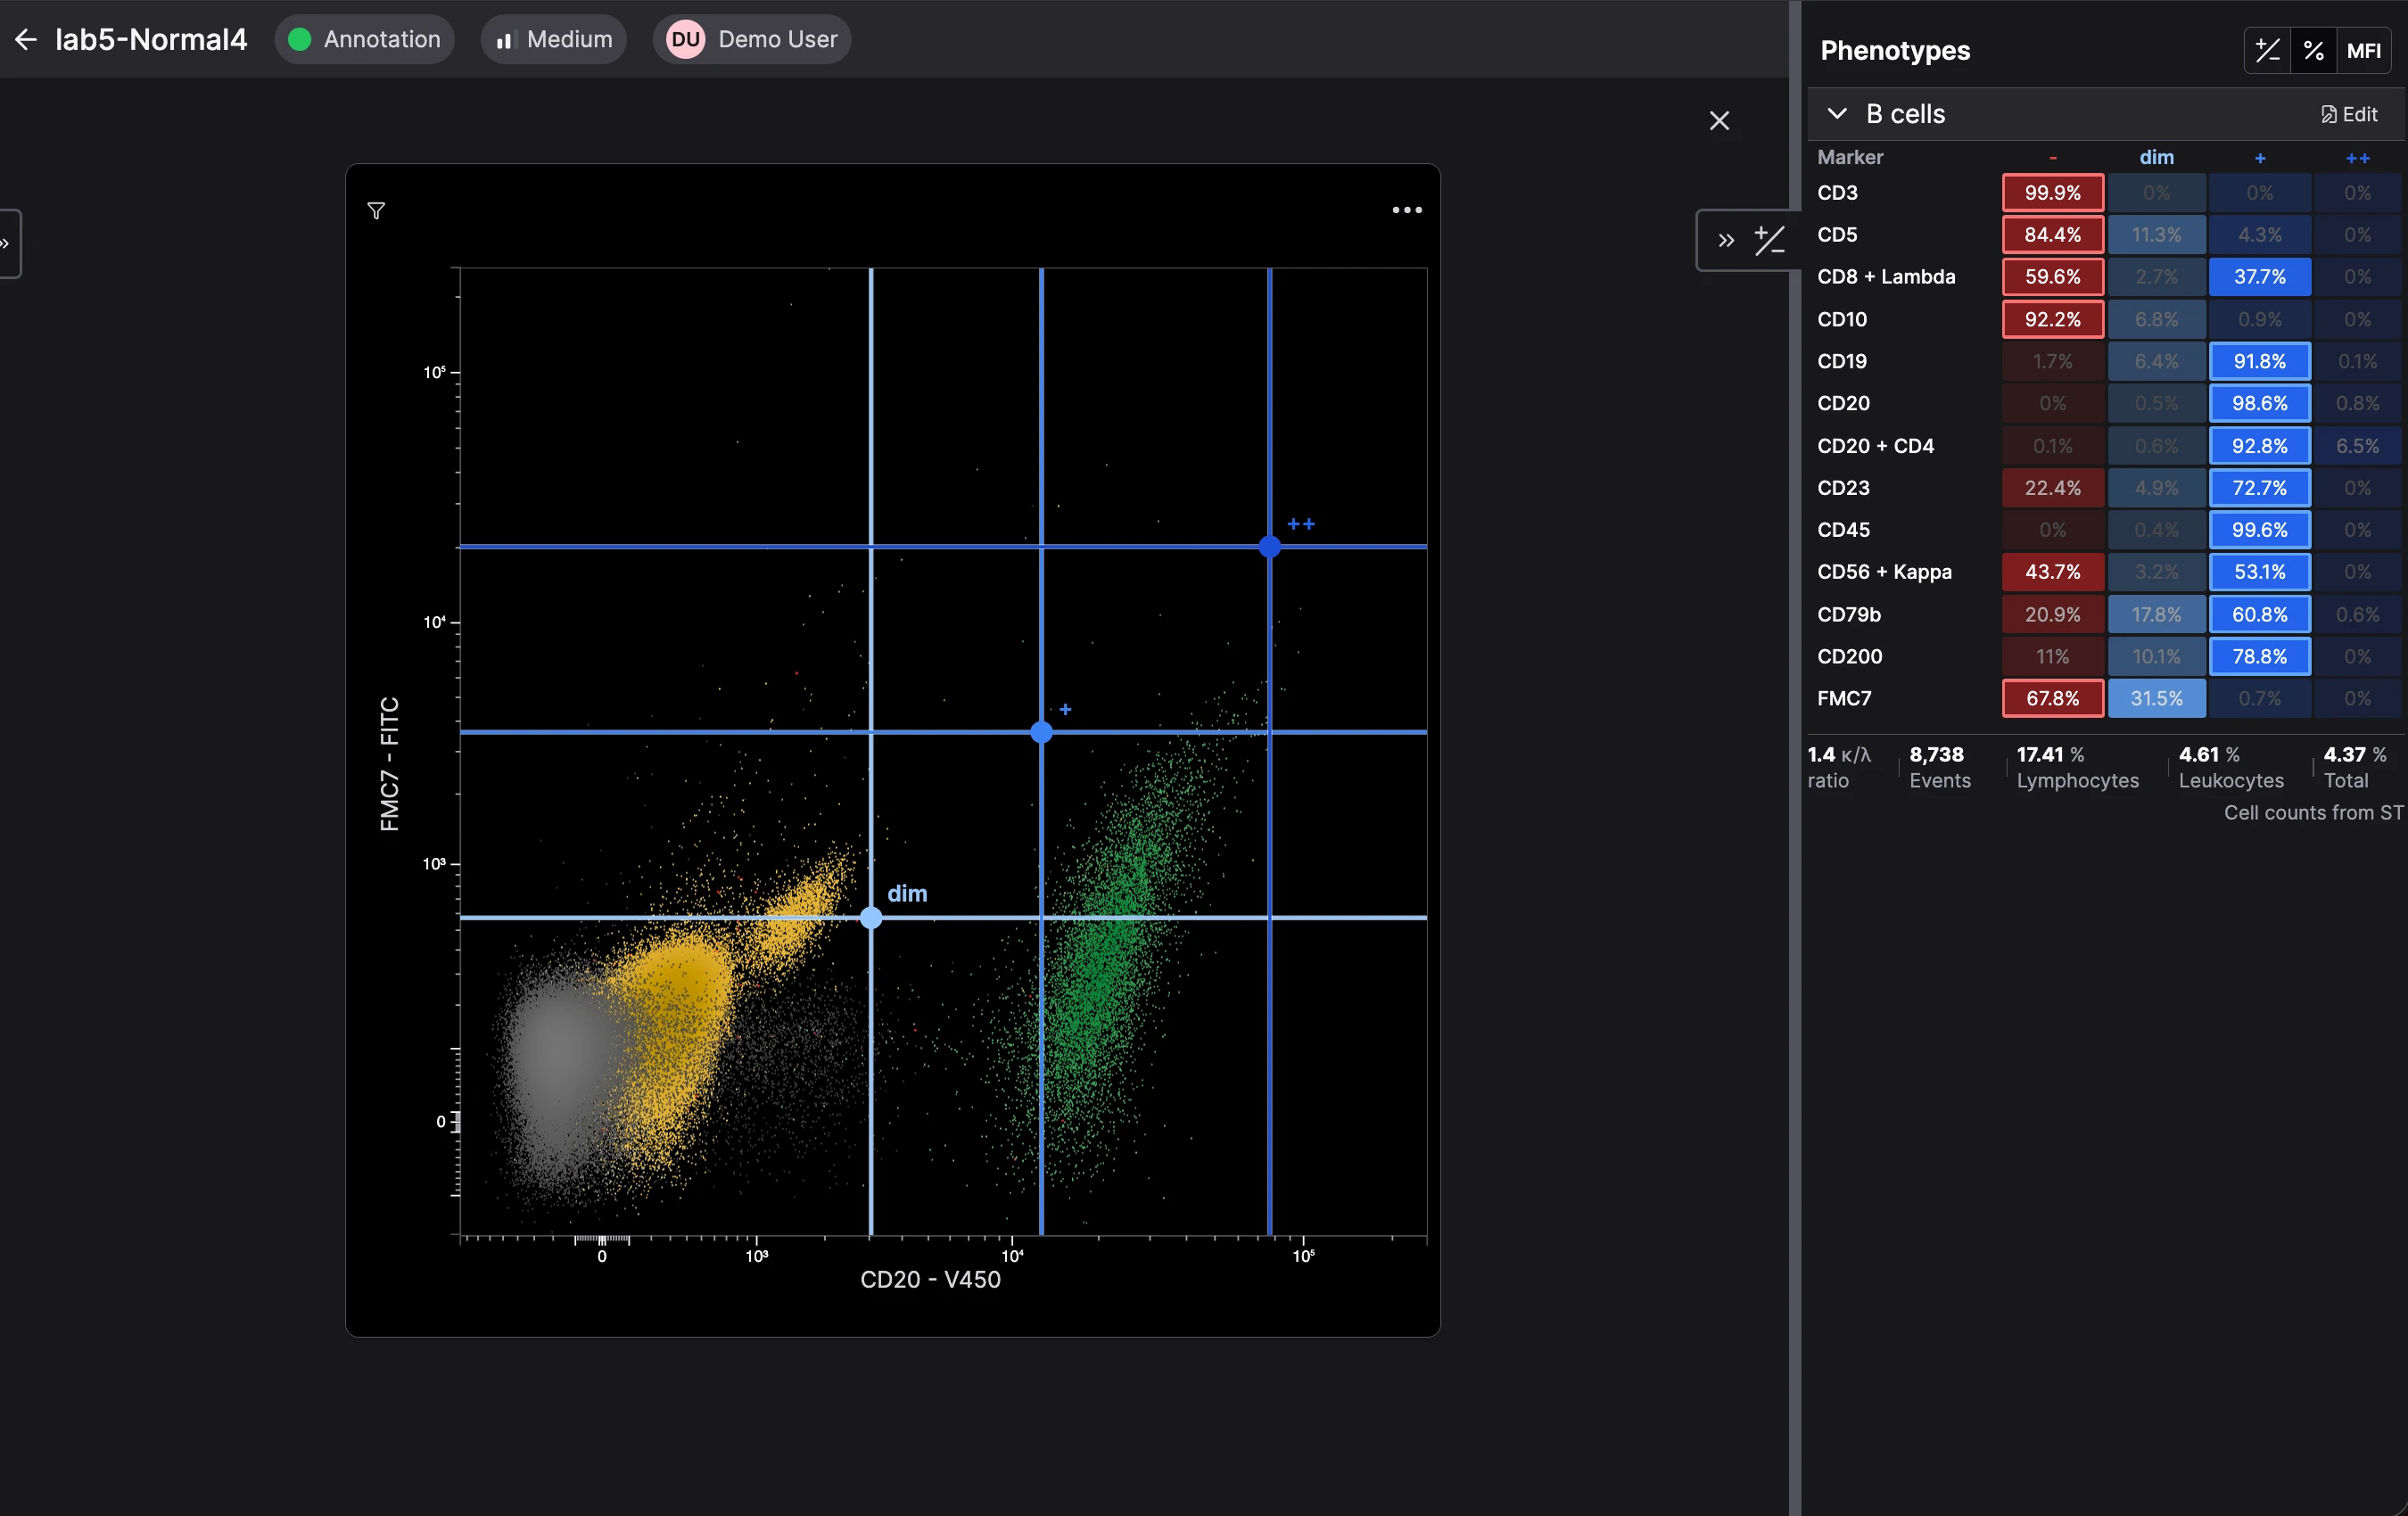
    CellStudio scatter plot with adjustable phenotype thresholds and a table of marker expression statistics

    Case Flags

    Automated
    Flag Rules and quality checks run automatically on every case, drawing on a built-in library based on WHO recommendations.
    You control
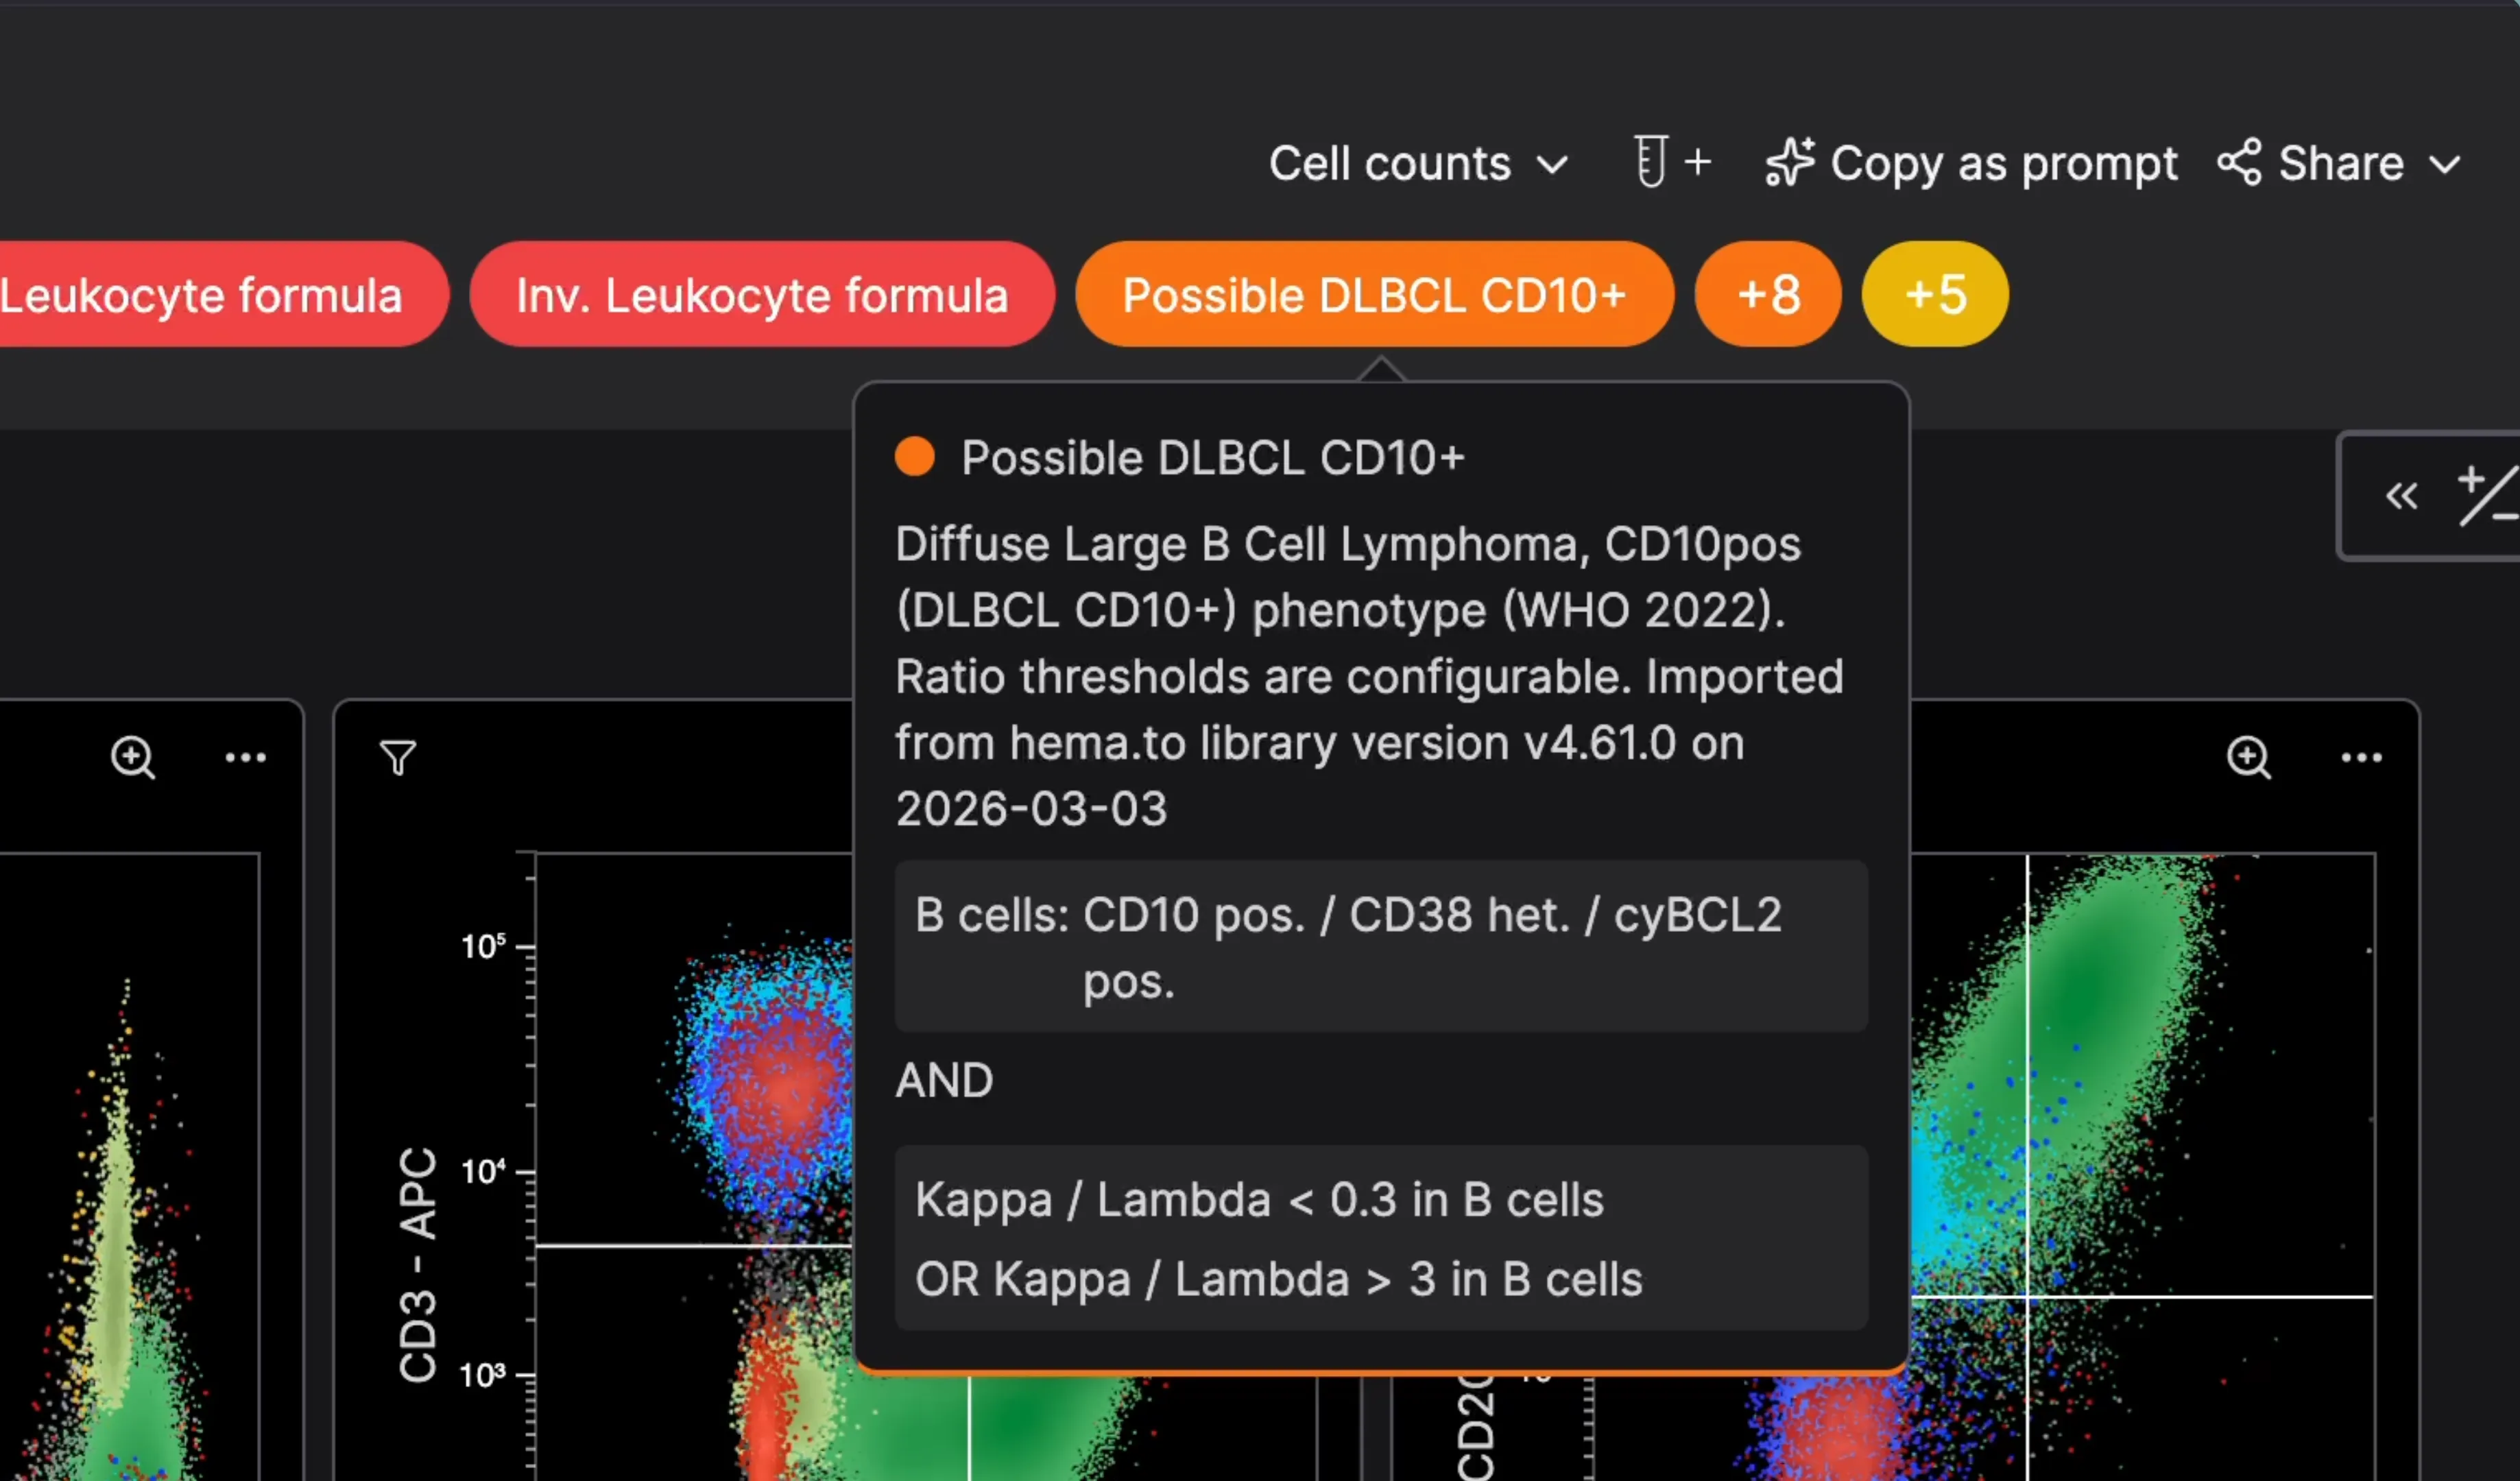
    You can create your own Flag Rules and quality checks based on cell counts, population frequencies, phenotypes, ratios and event counts. Flags can be assigned a severity and be filtered in your Case List.
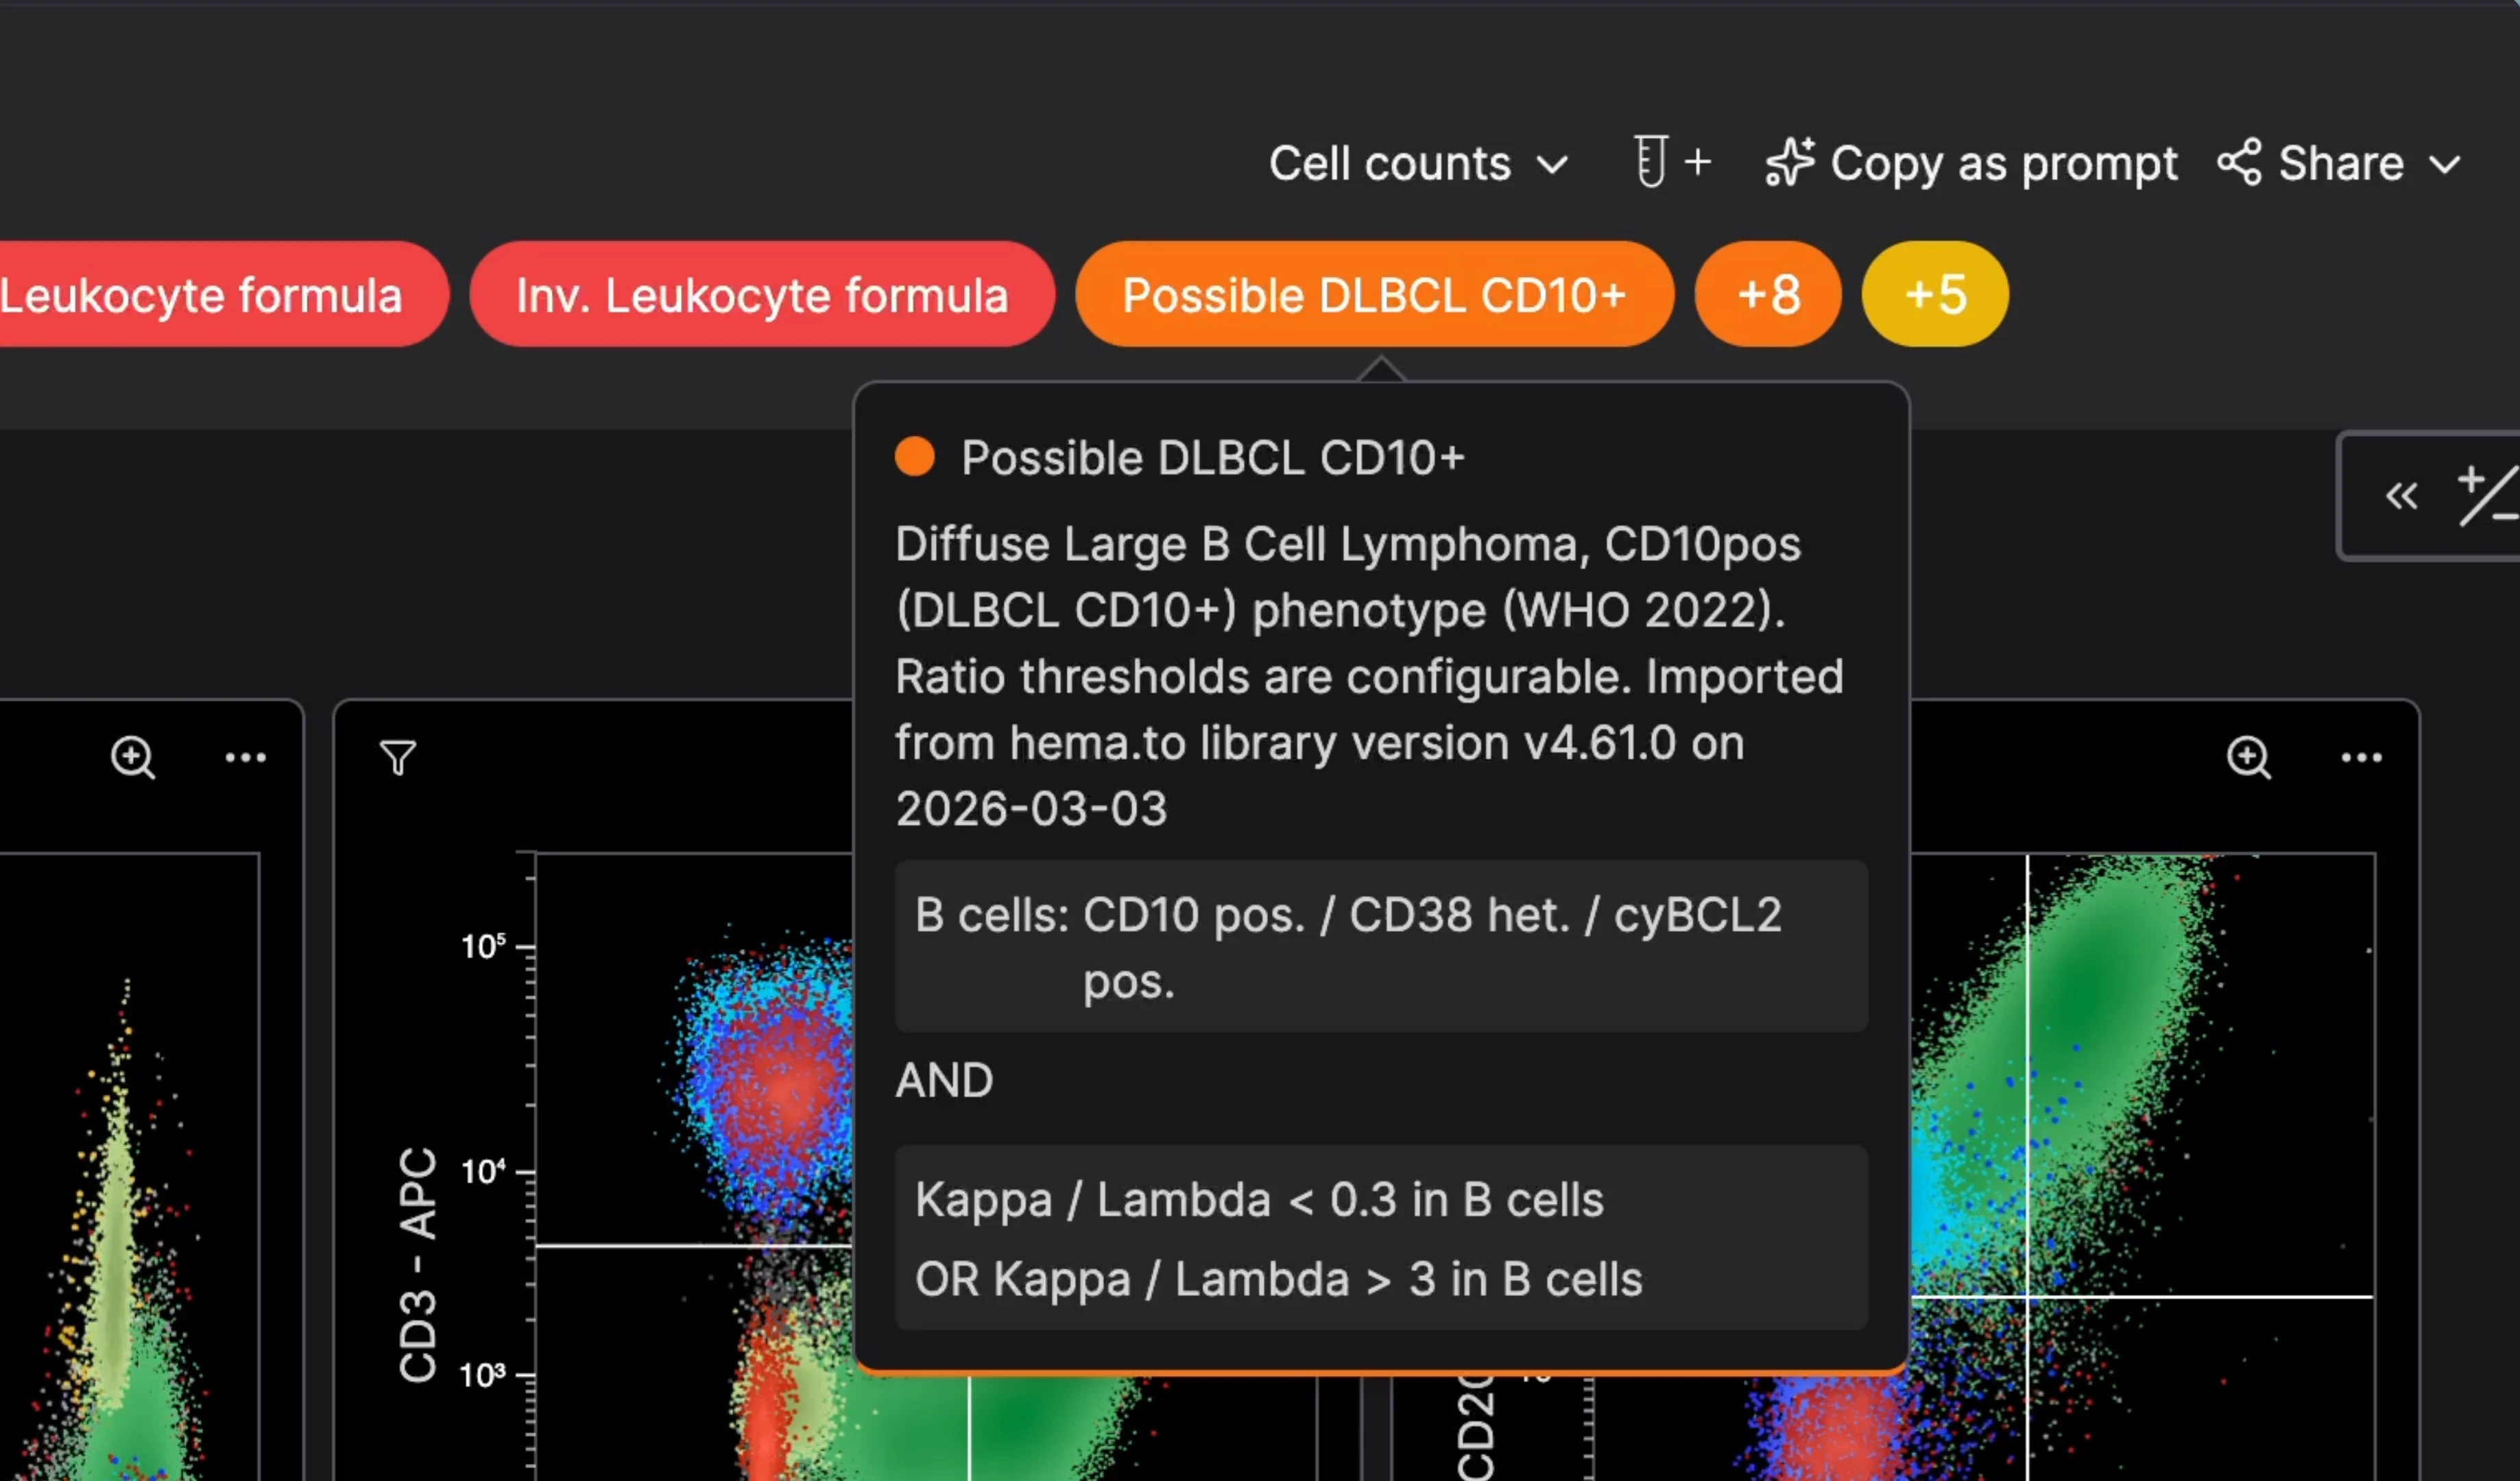
    CellStudio Case Flags with details of a phenotype-based Flag Rule for possible DLBCL CD10+
  3. Analyzed data is reviewed

    Lasso tool

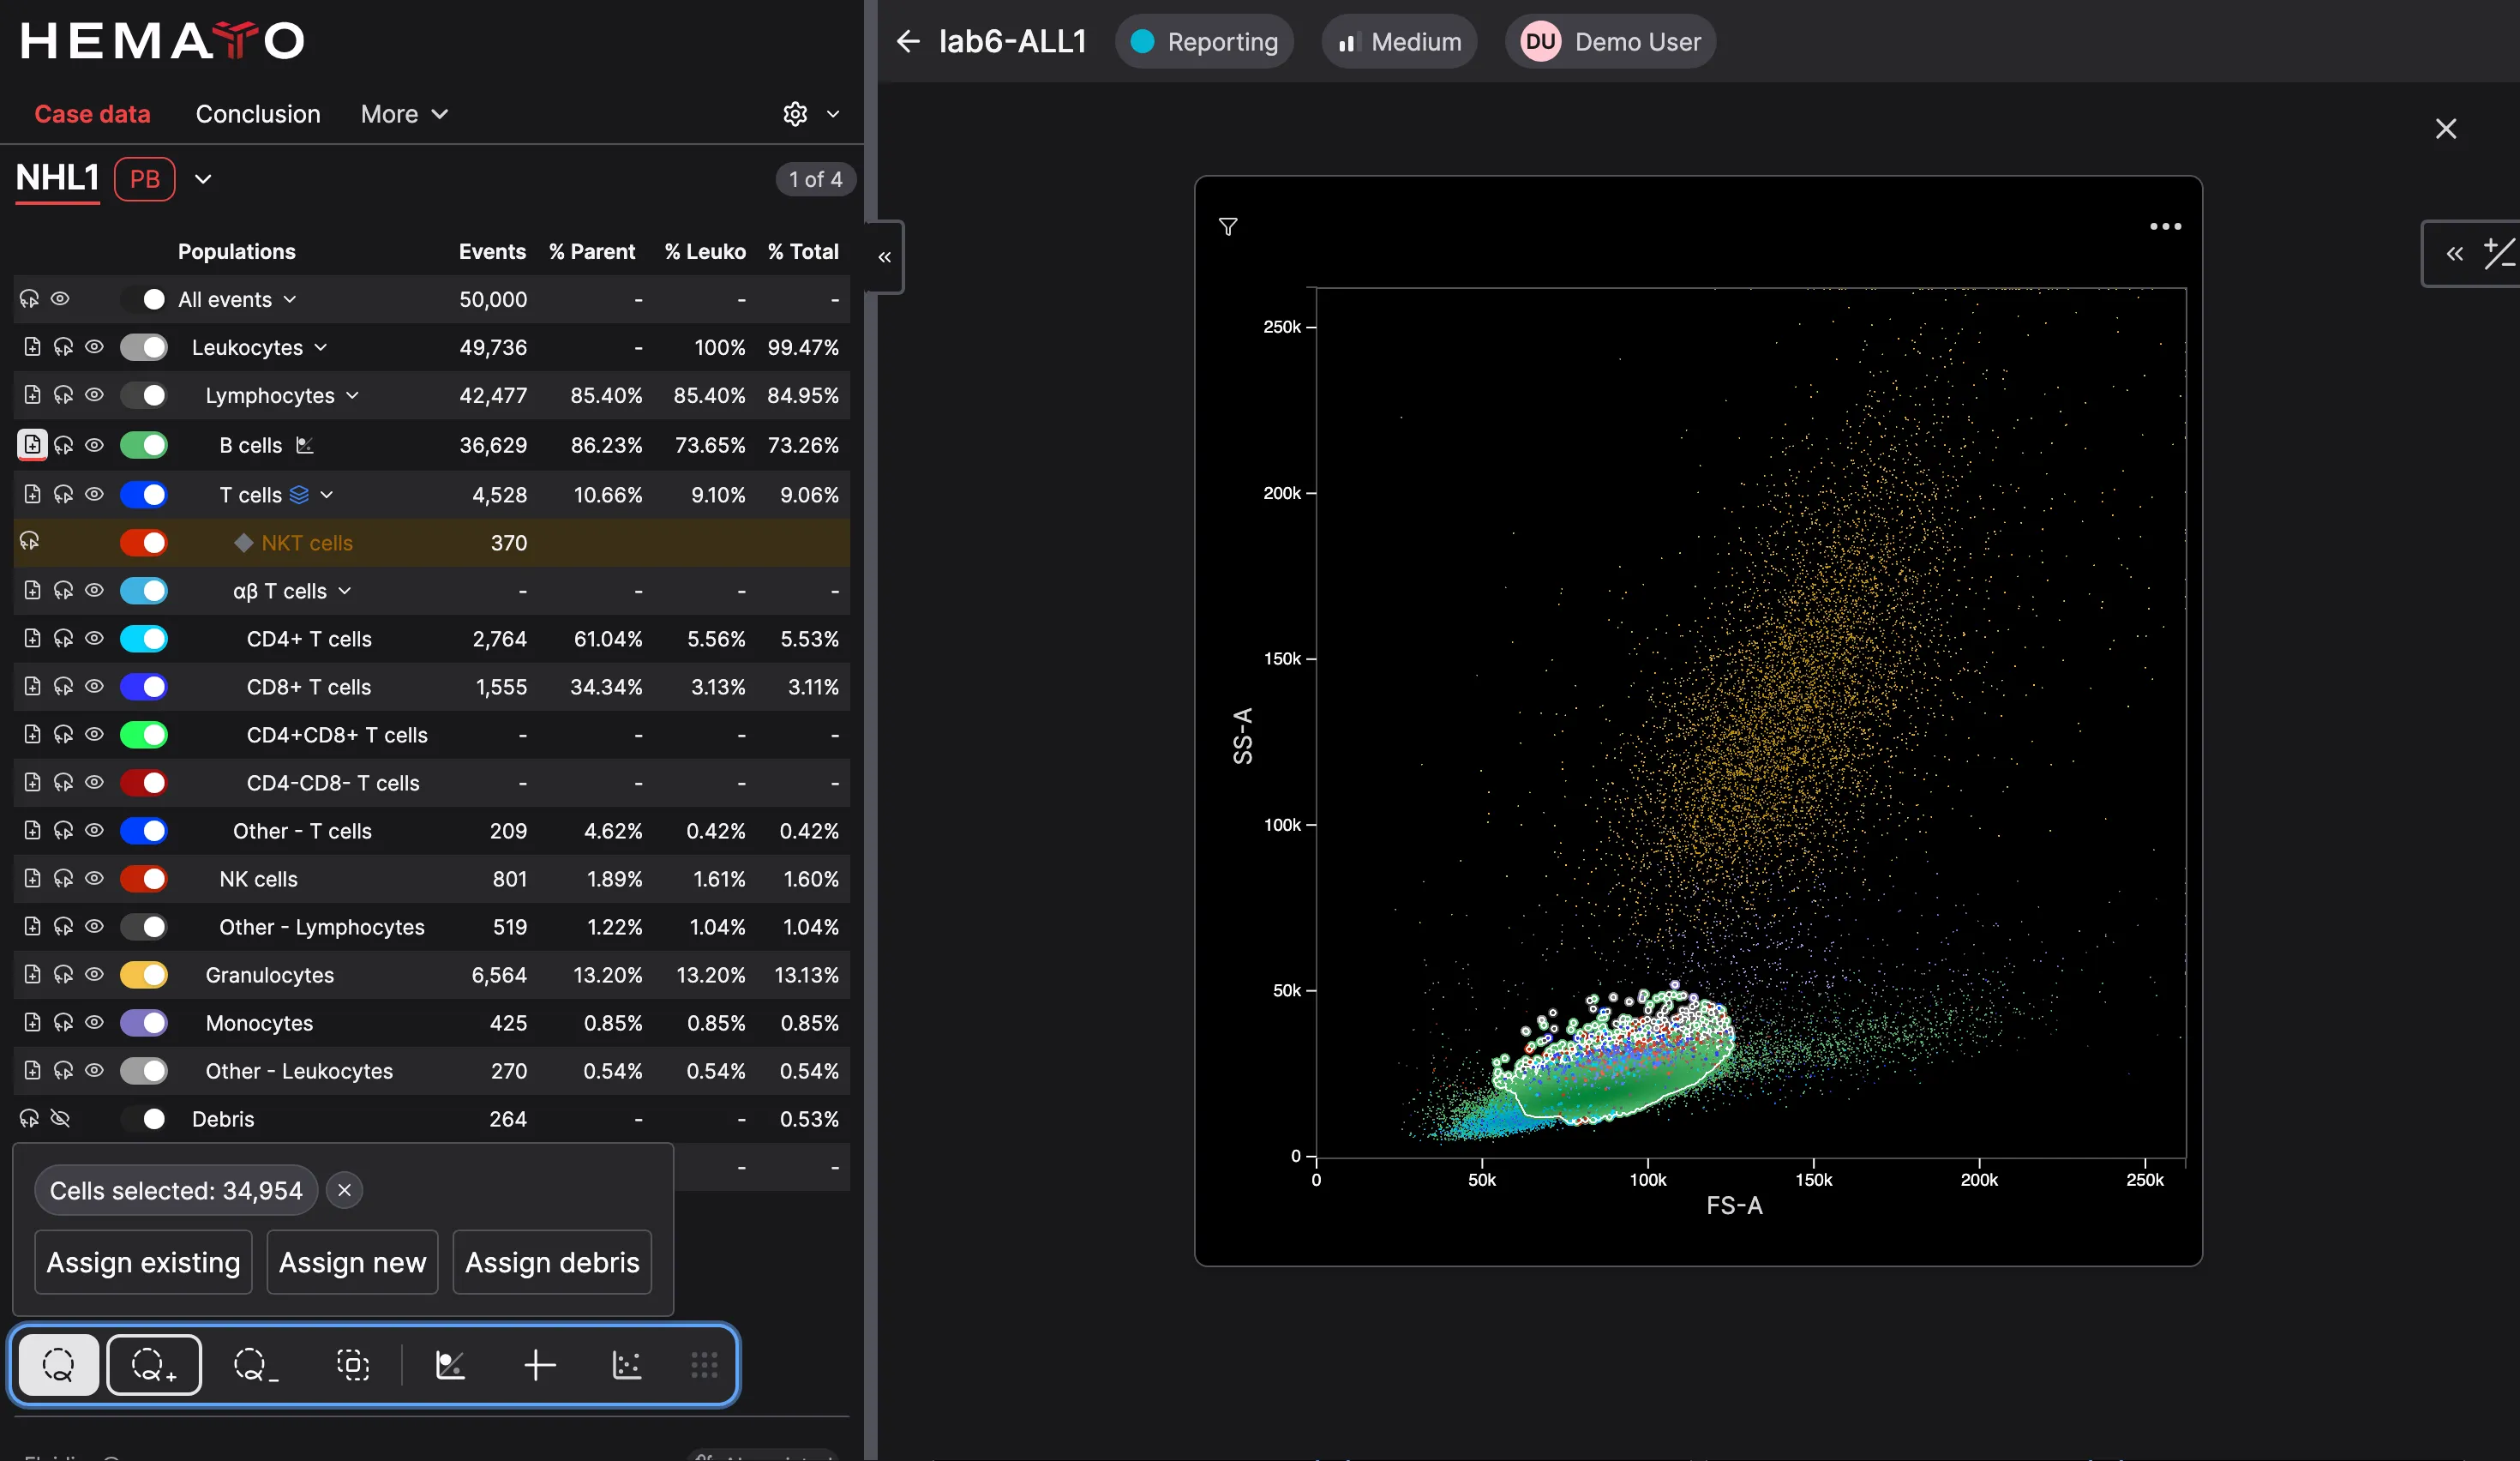
    CellStudio’s lasso tool allows detailed and versatile event selection and assignment across scatter plots. Phenotypes and cell counts update in real-time in response to event selections and annotations you apply.

    Case Workflow

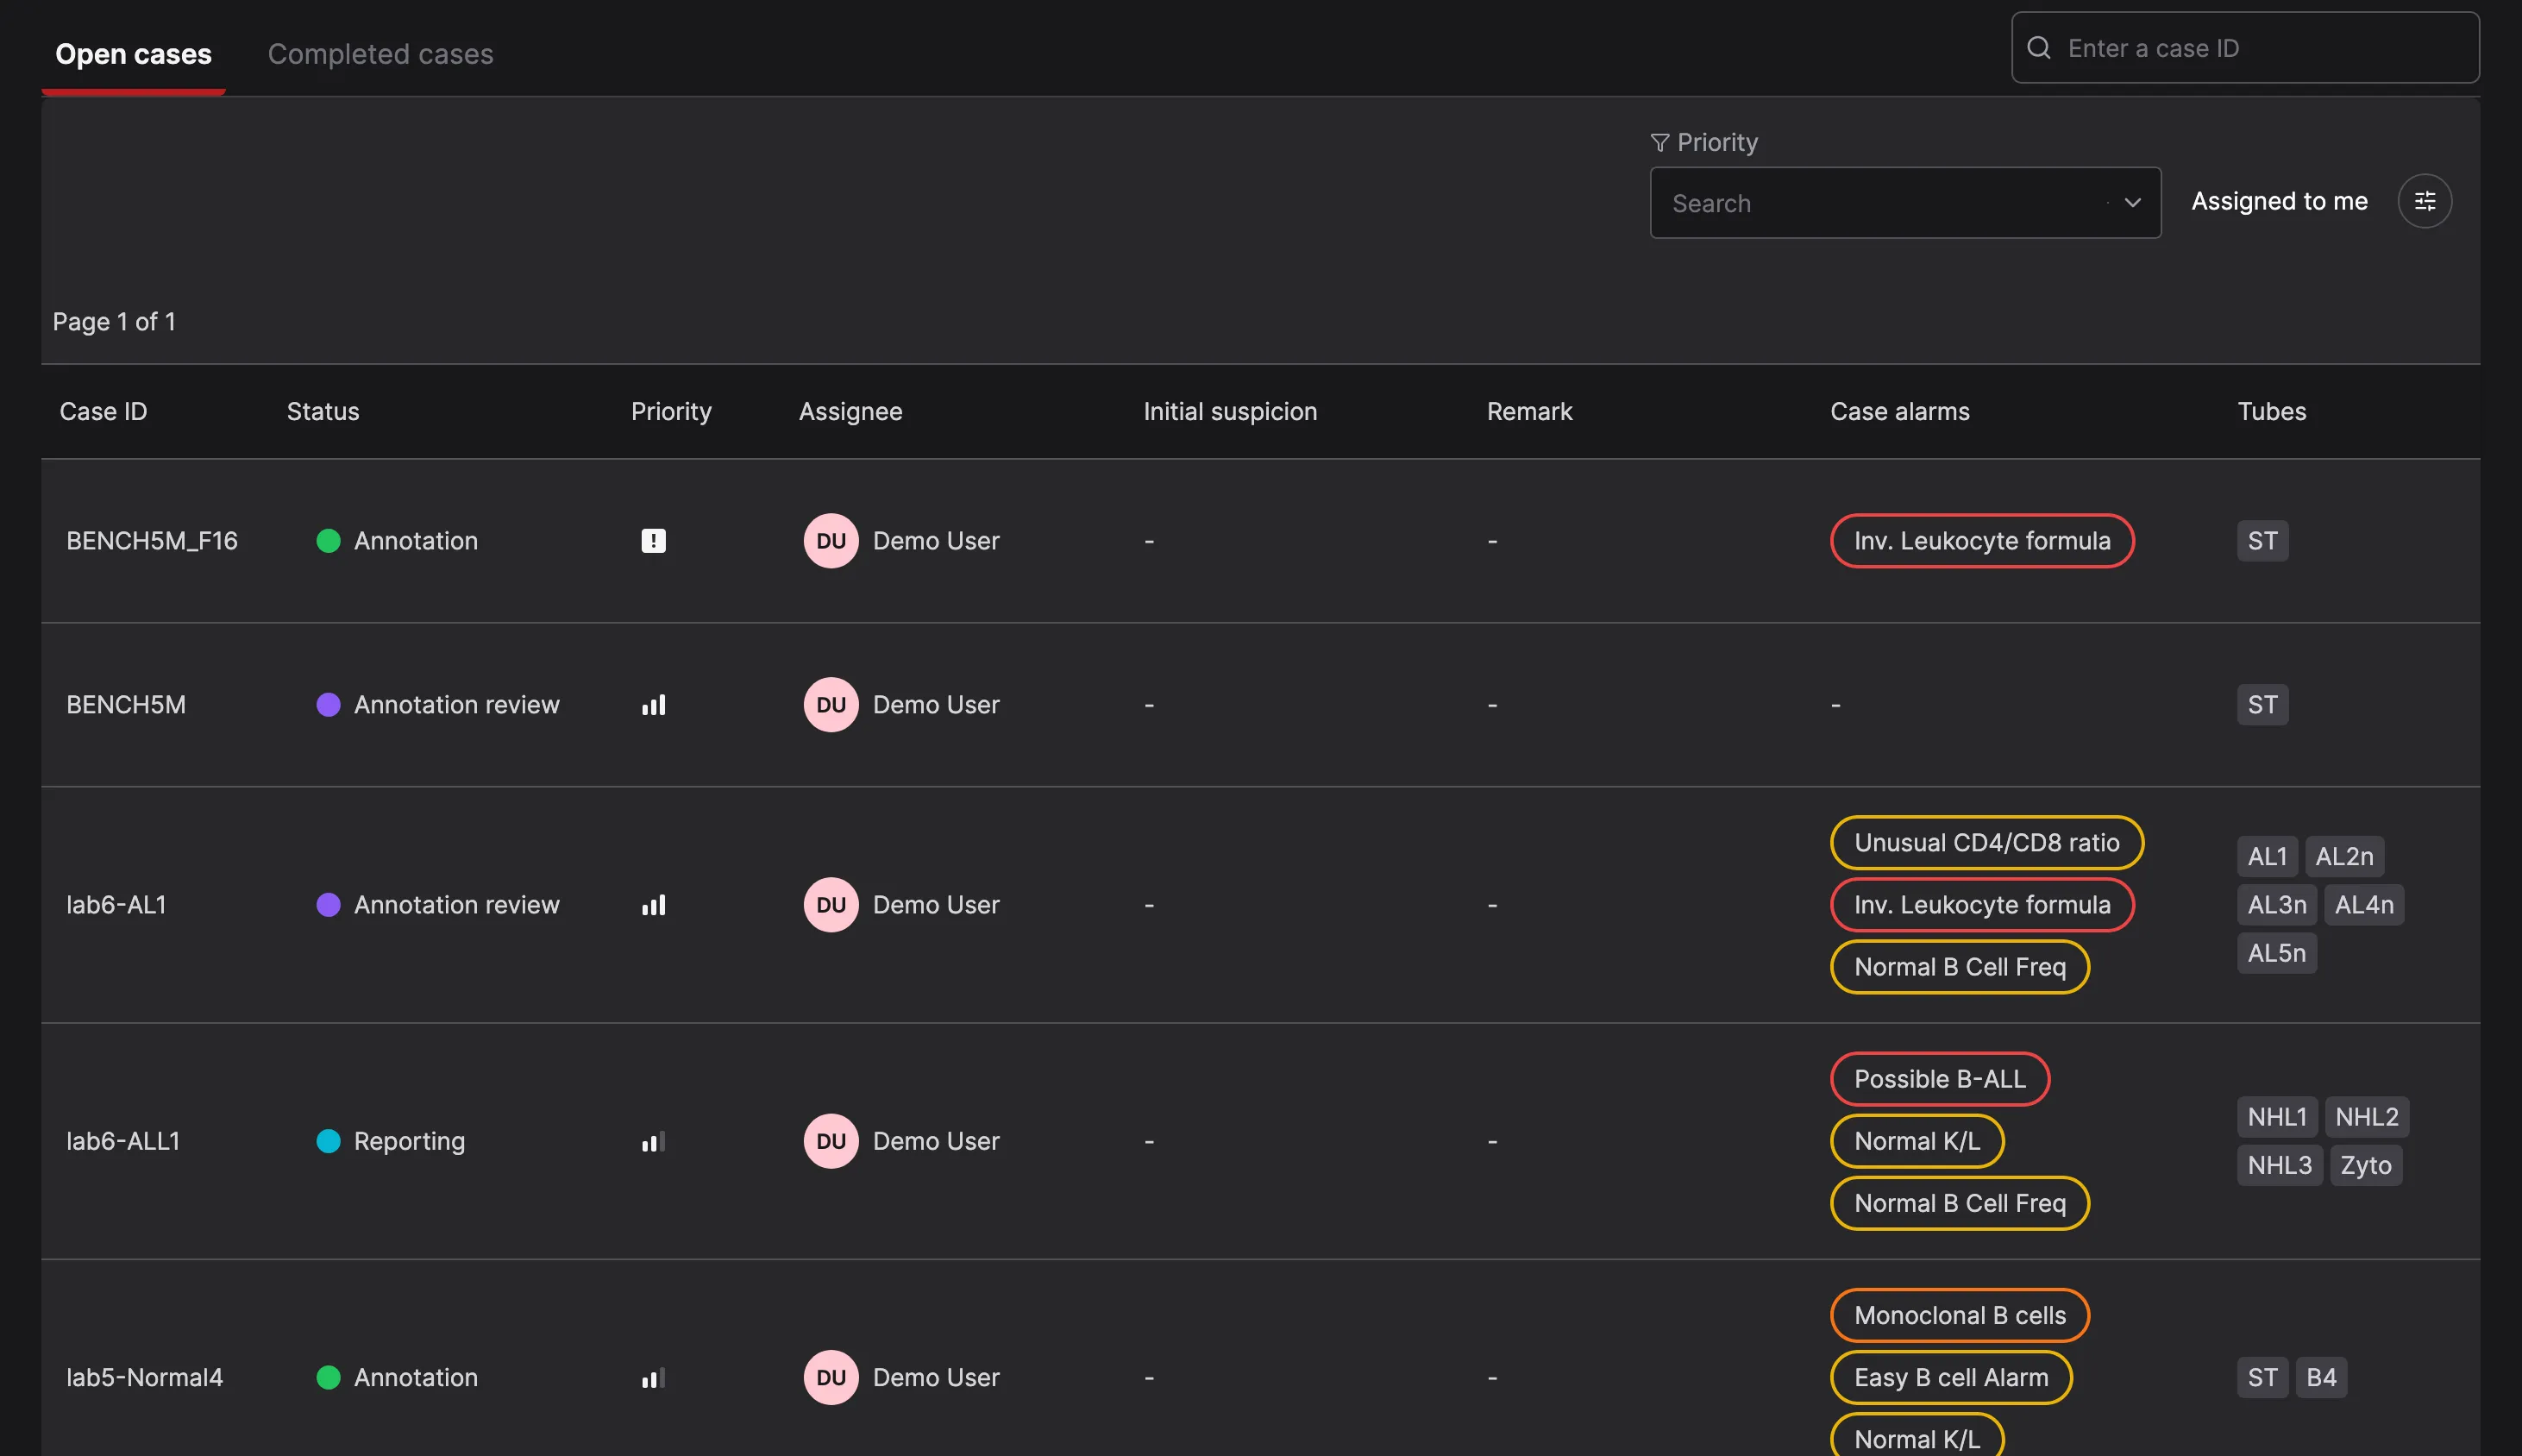
    Cases can be prioritized, assigned to people and a Workflow Status, as well as filtered in the Case List.

    Case versioning & audit logs

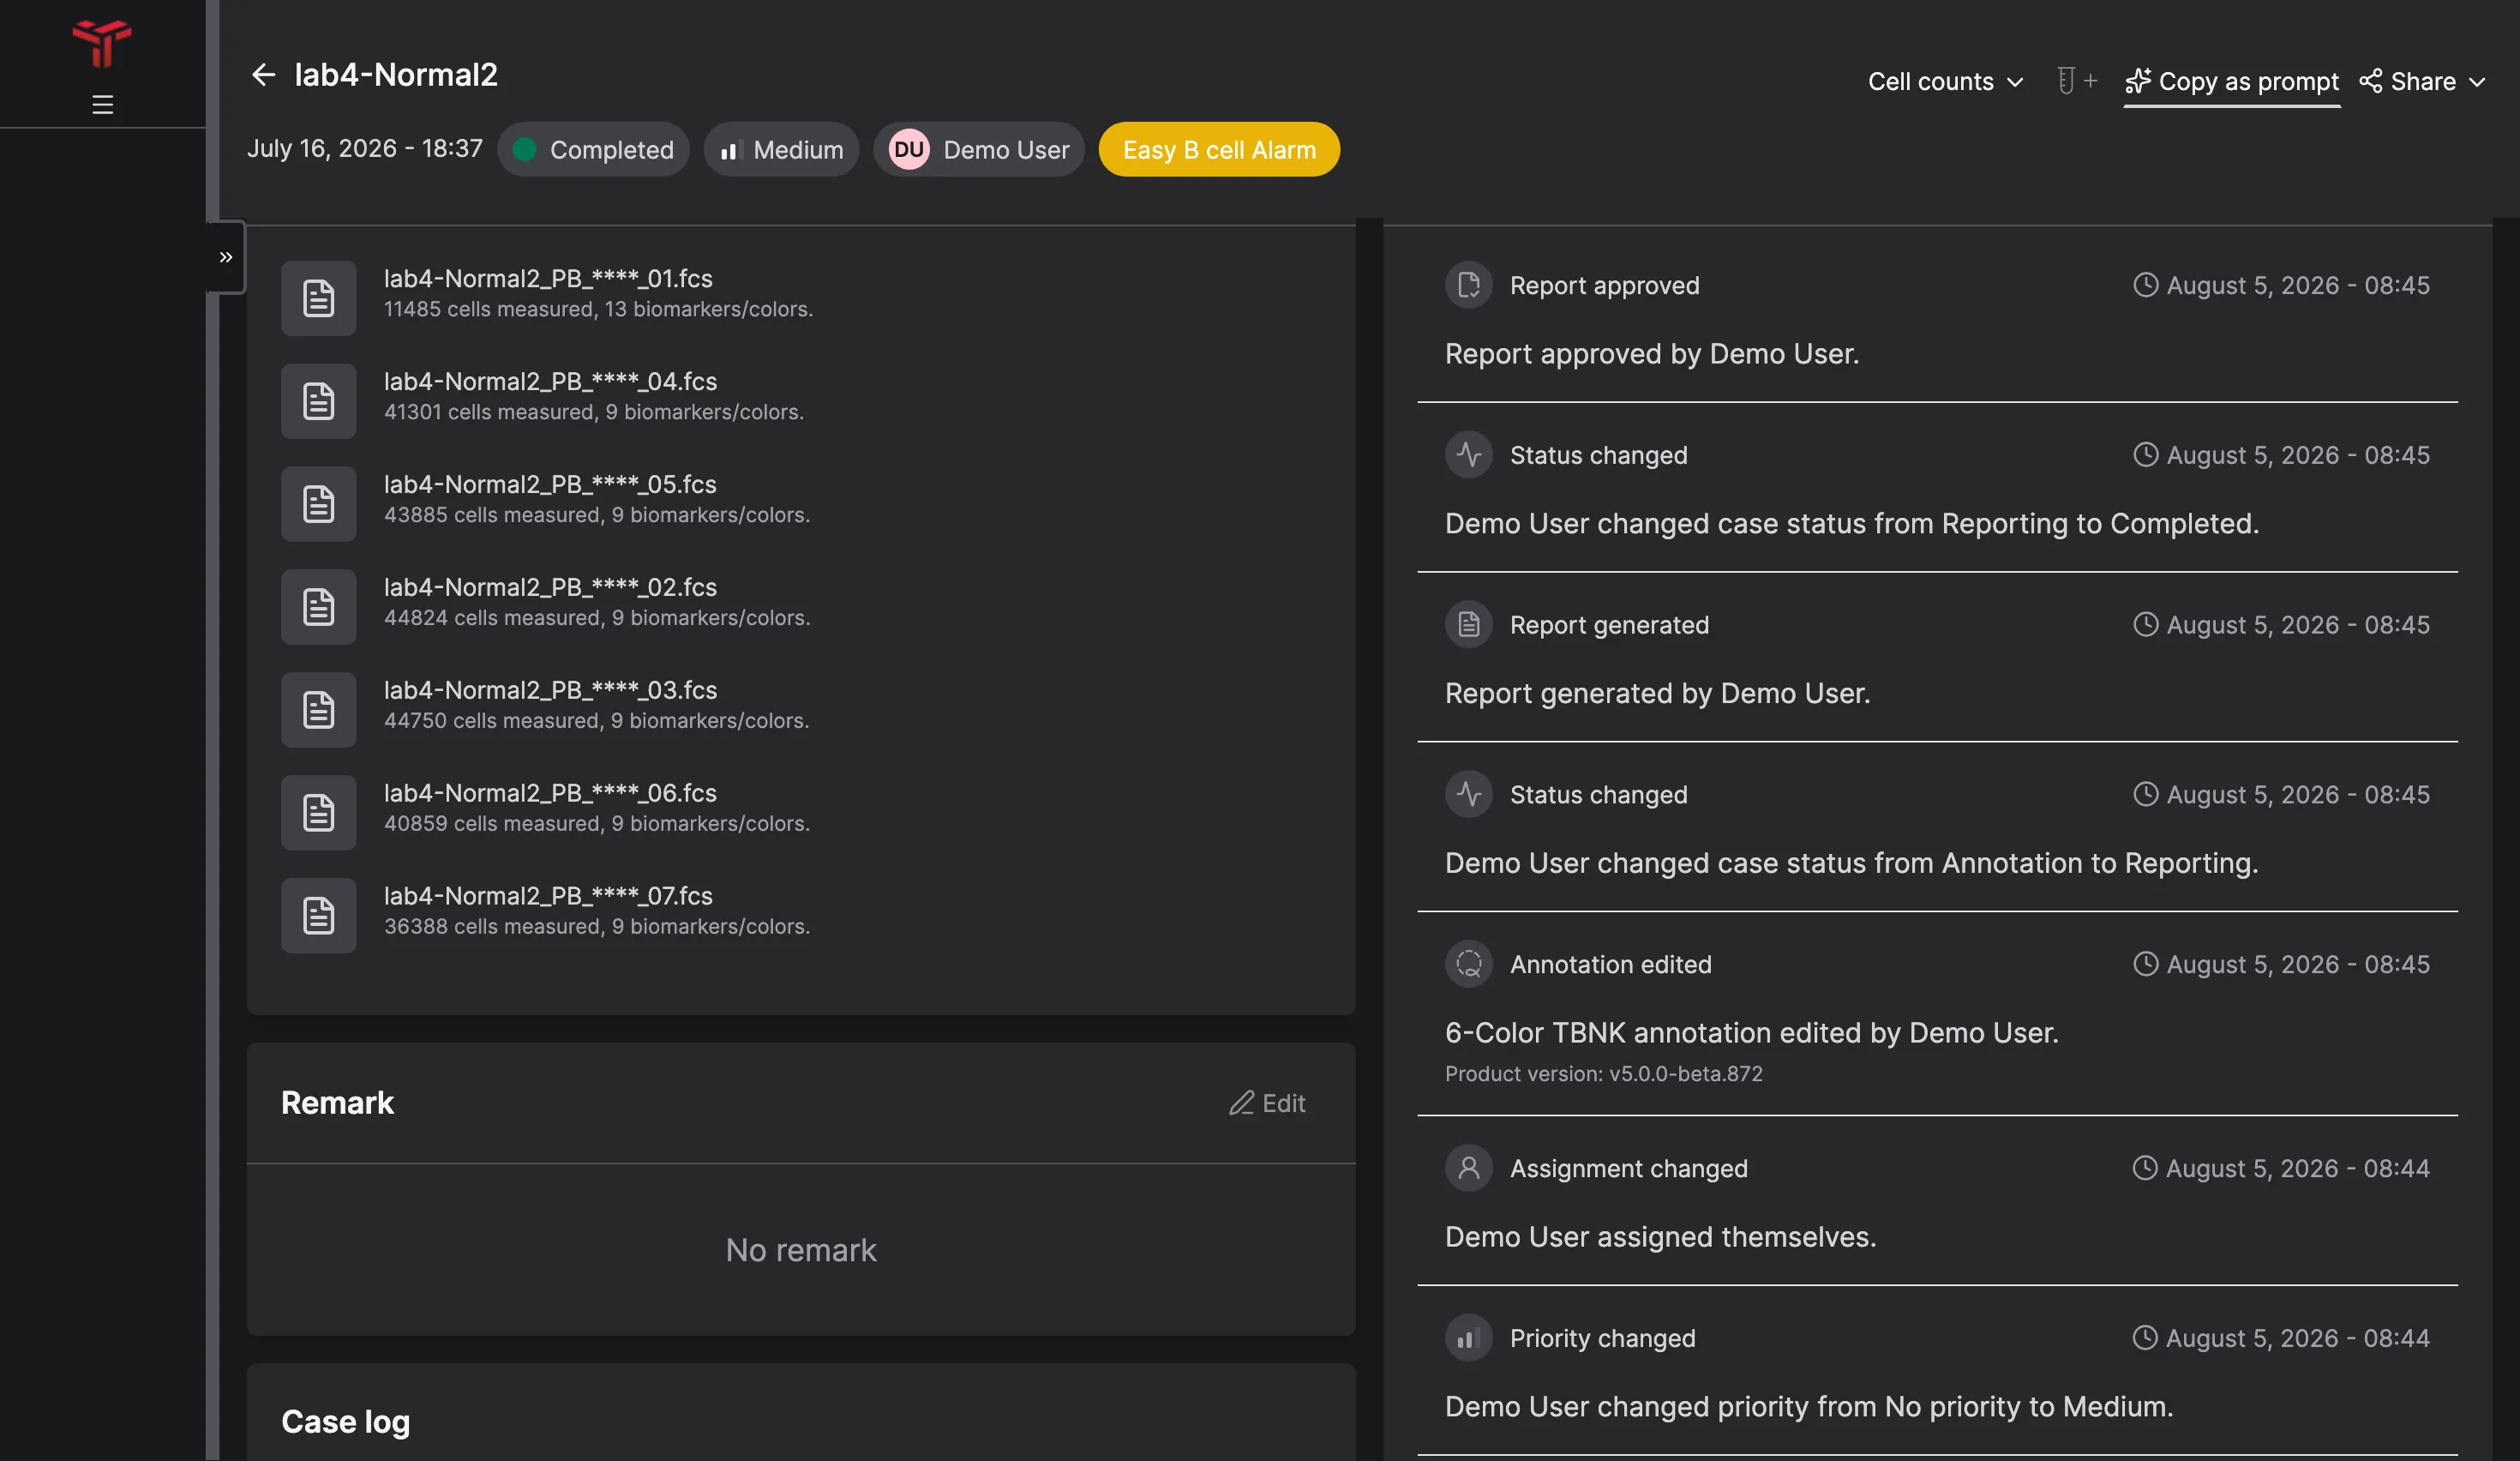
    CellStudio automatically creates annotation versions and audit logs for every change to a case. A case’s version history can be browsed and visually compared with a few clicks.

  4. A print-ready report is generated in one click

    Text, CSV or PDF? A report with your results is generated with one click, configured to your unique reporting requirements.

Automated predictions for every case.

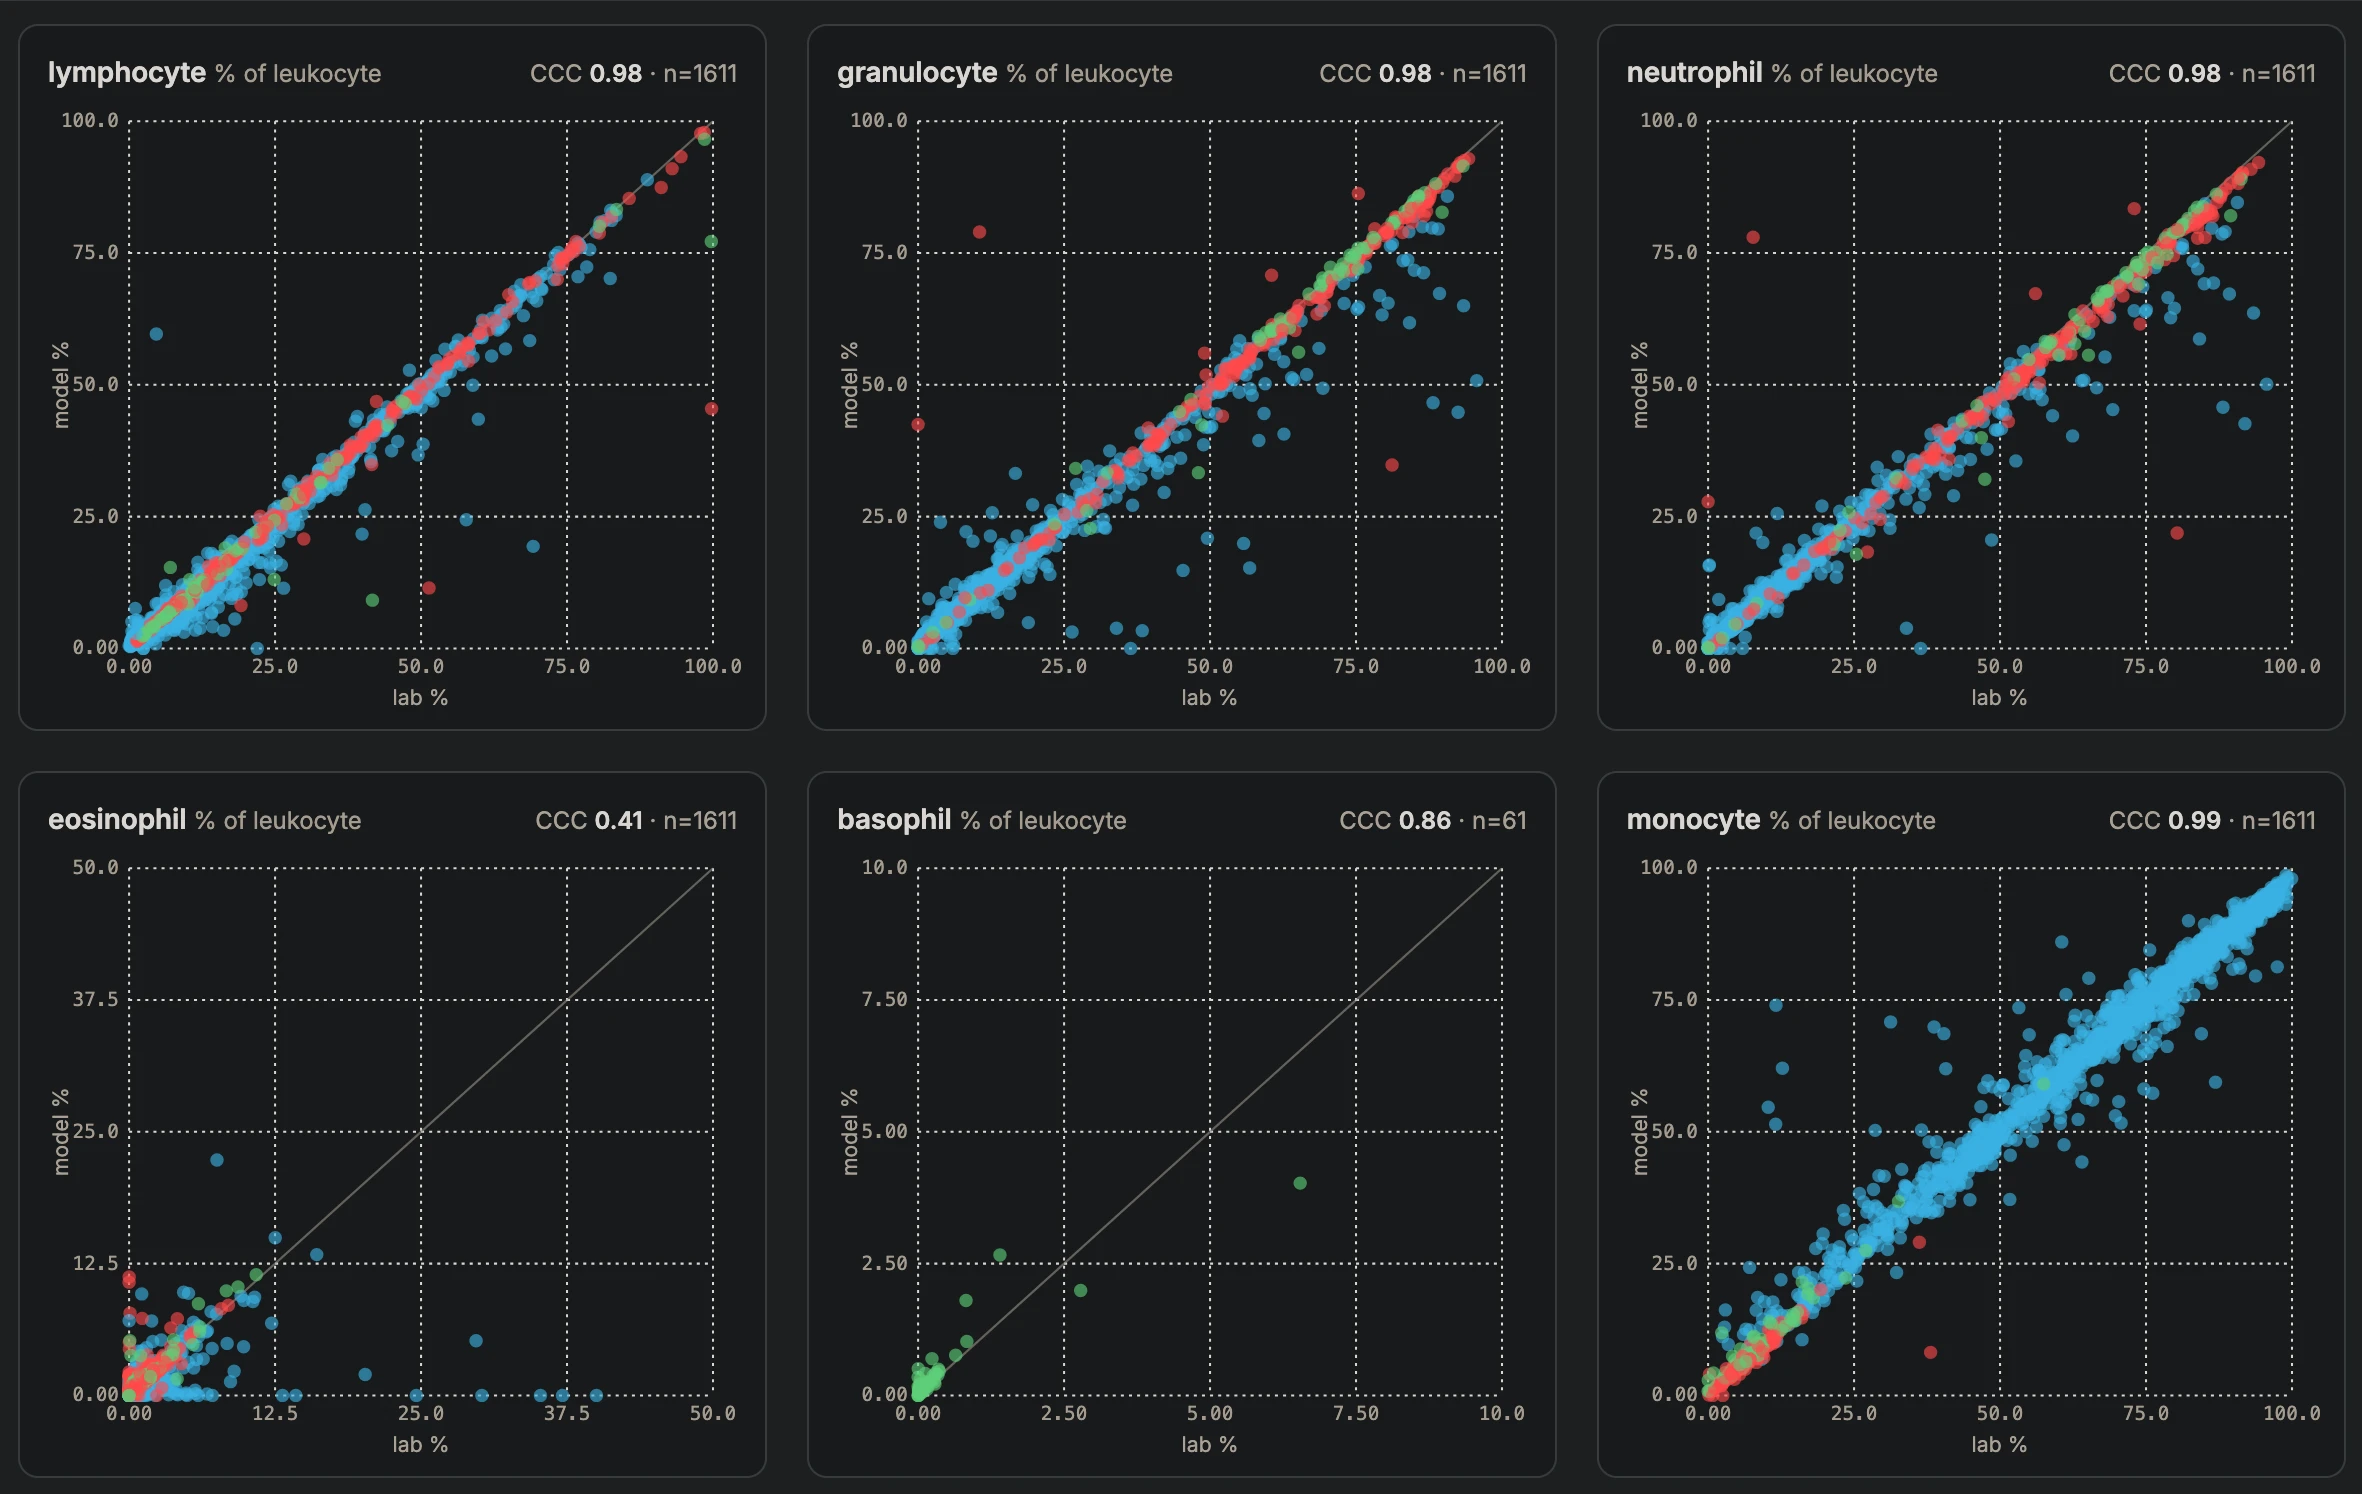
  • Correlation plots comparing CellStudio's AI model with laboratory cell population counts

    A model for your data

    We use cases from your lab and combine them with hema.to’s large, internal case database to create an AI model fine-tuned to your panels and data.

    Correlation plots comparing CellStudio's AI model with laboratory cell population counts
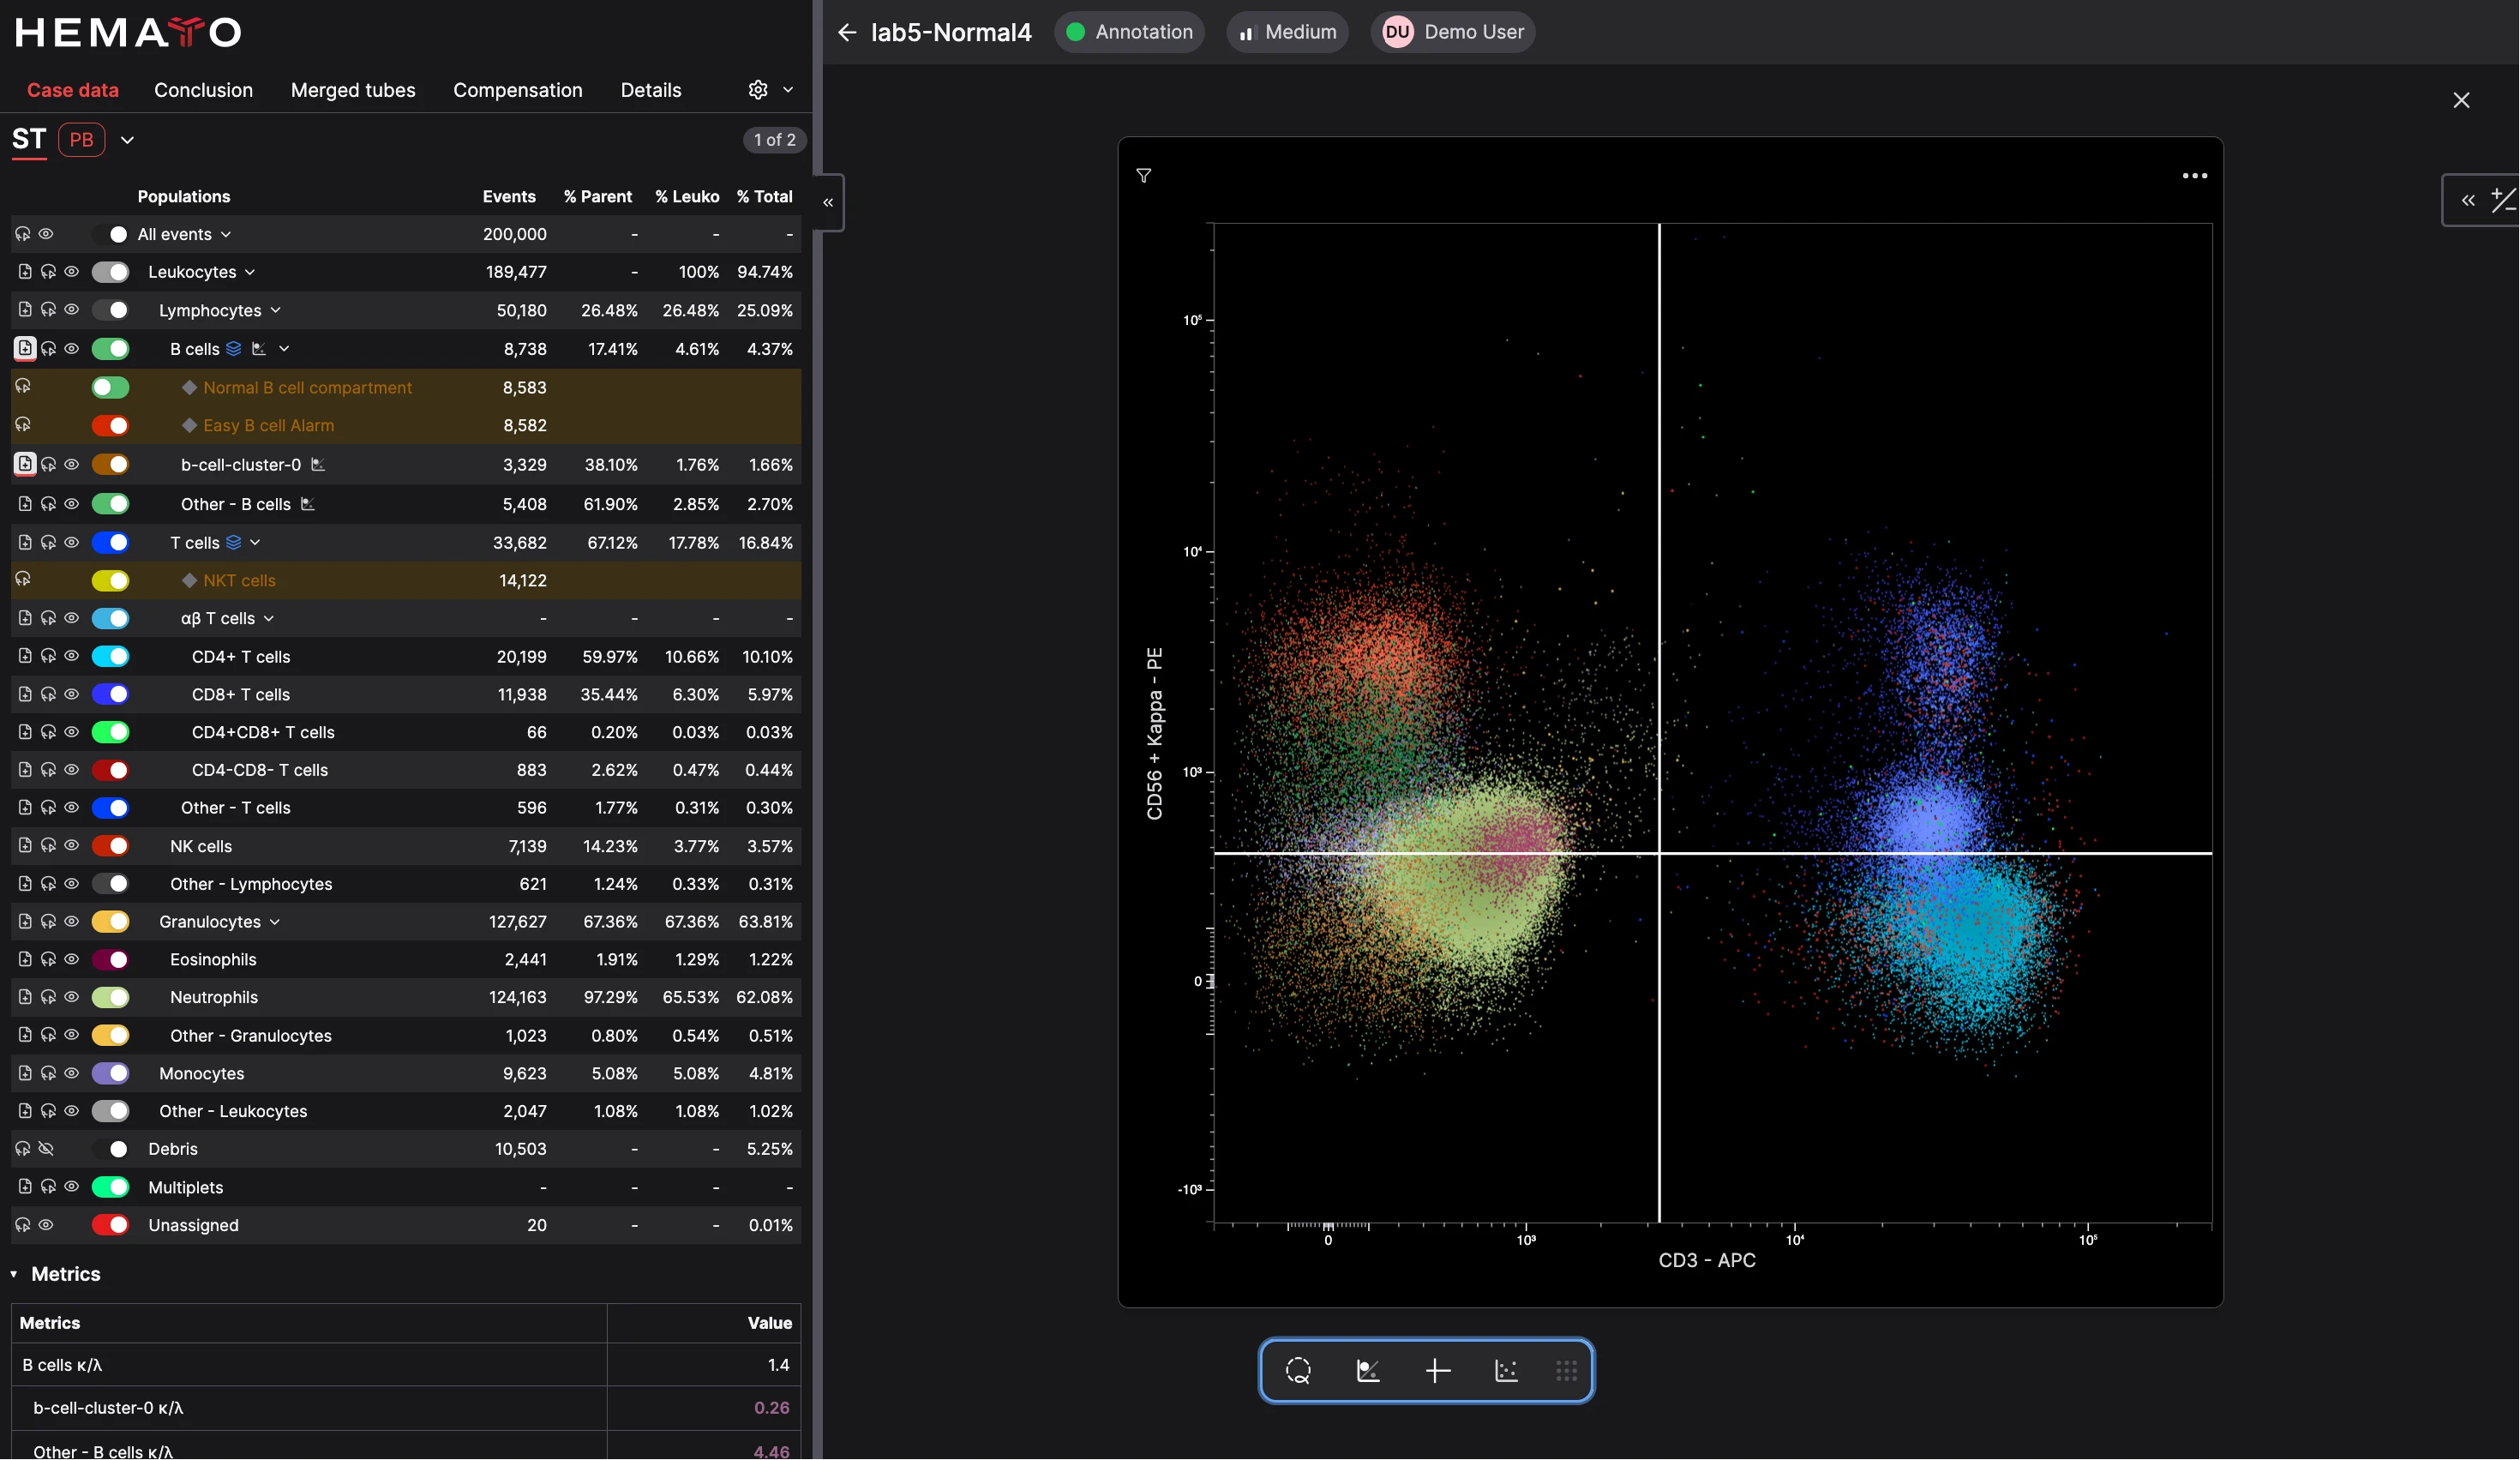
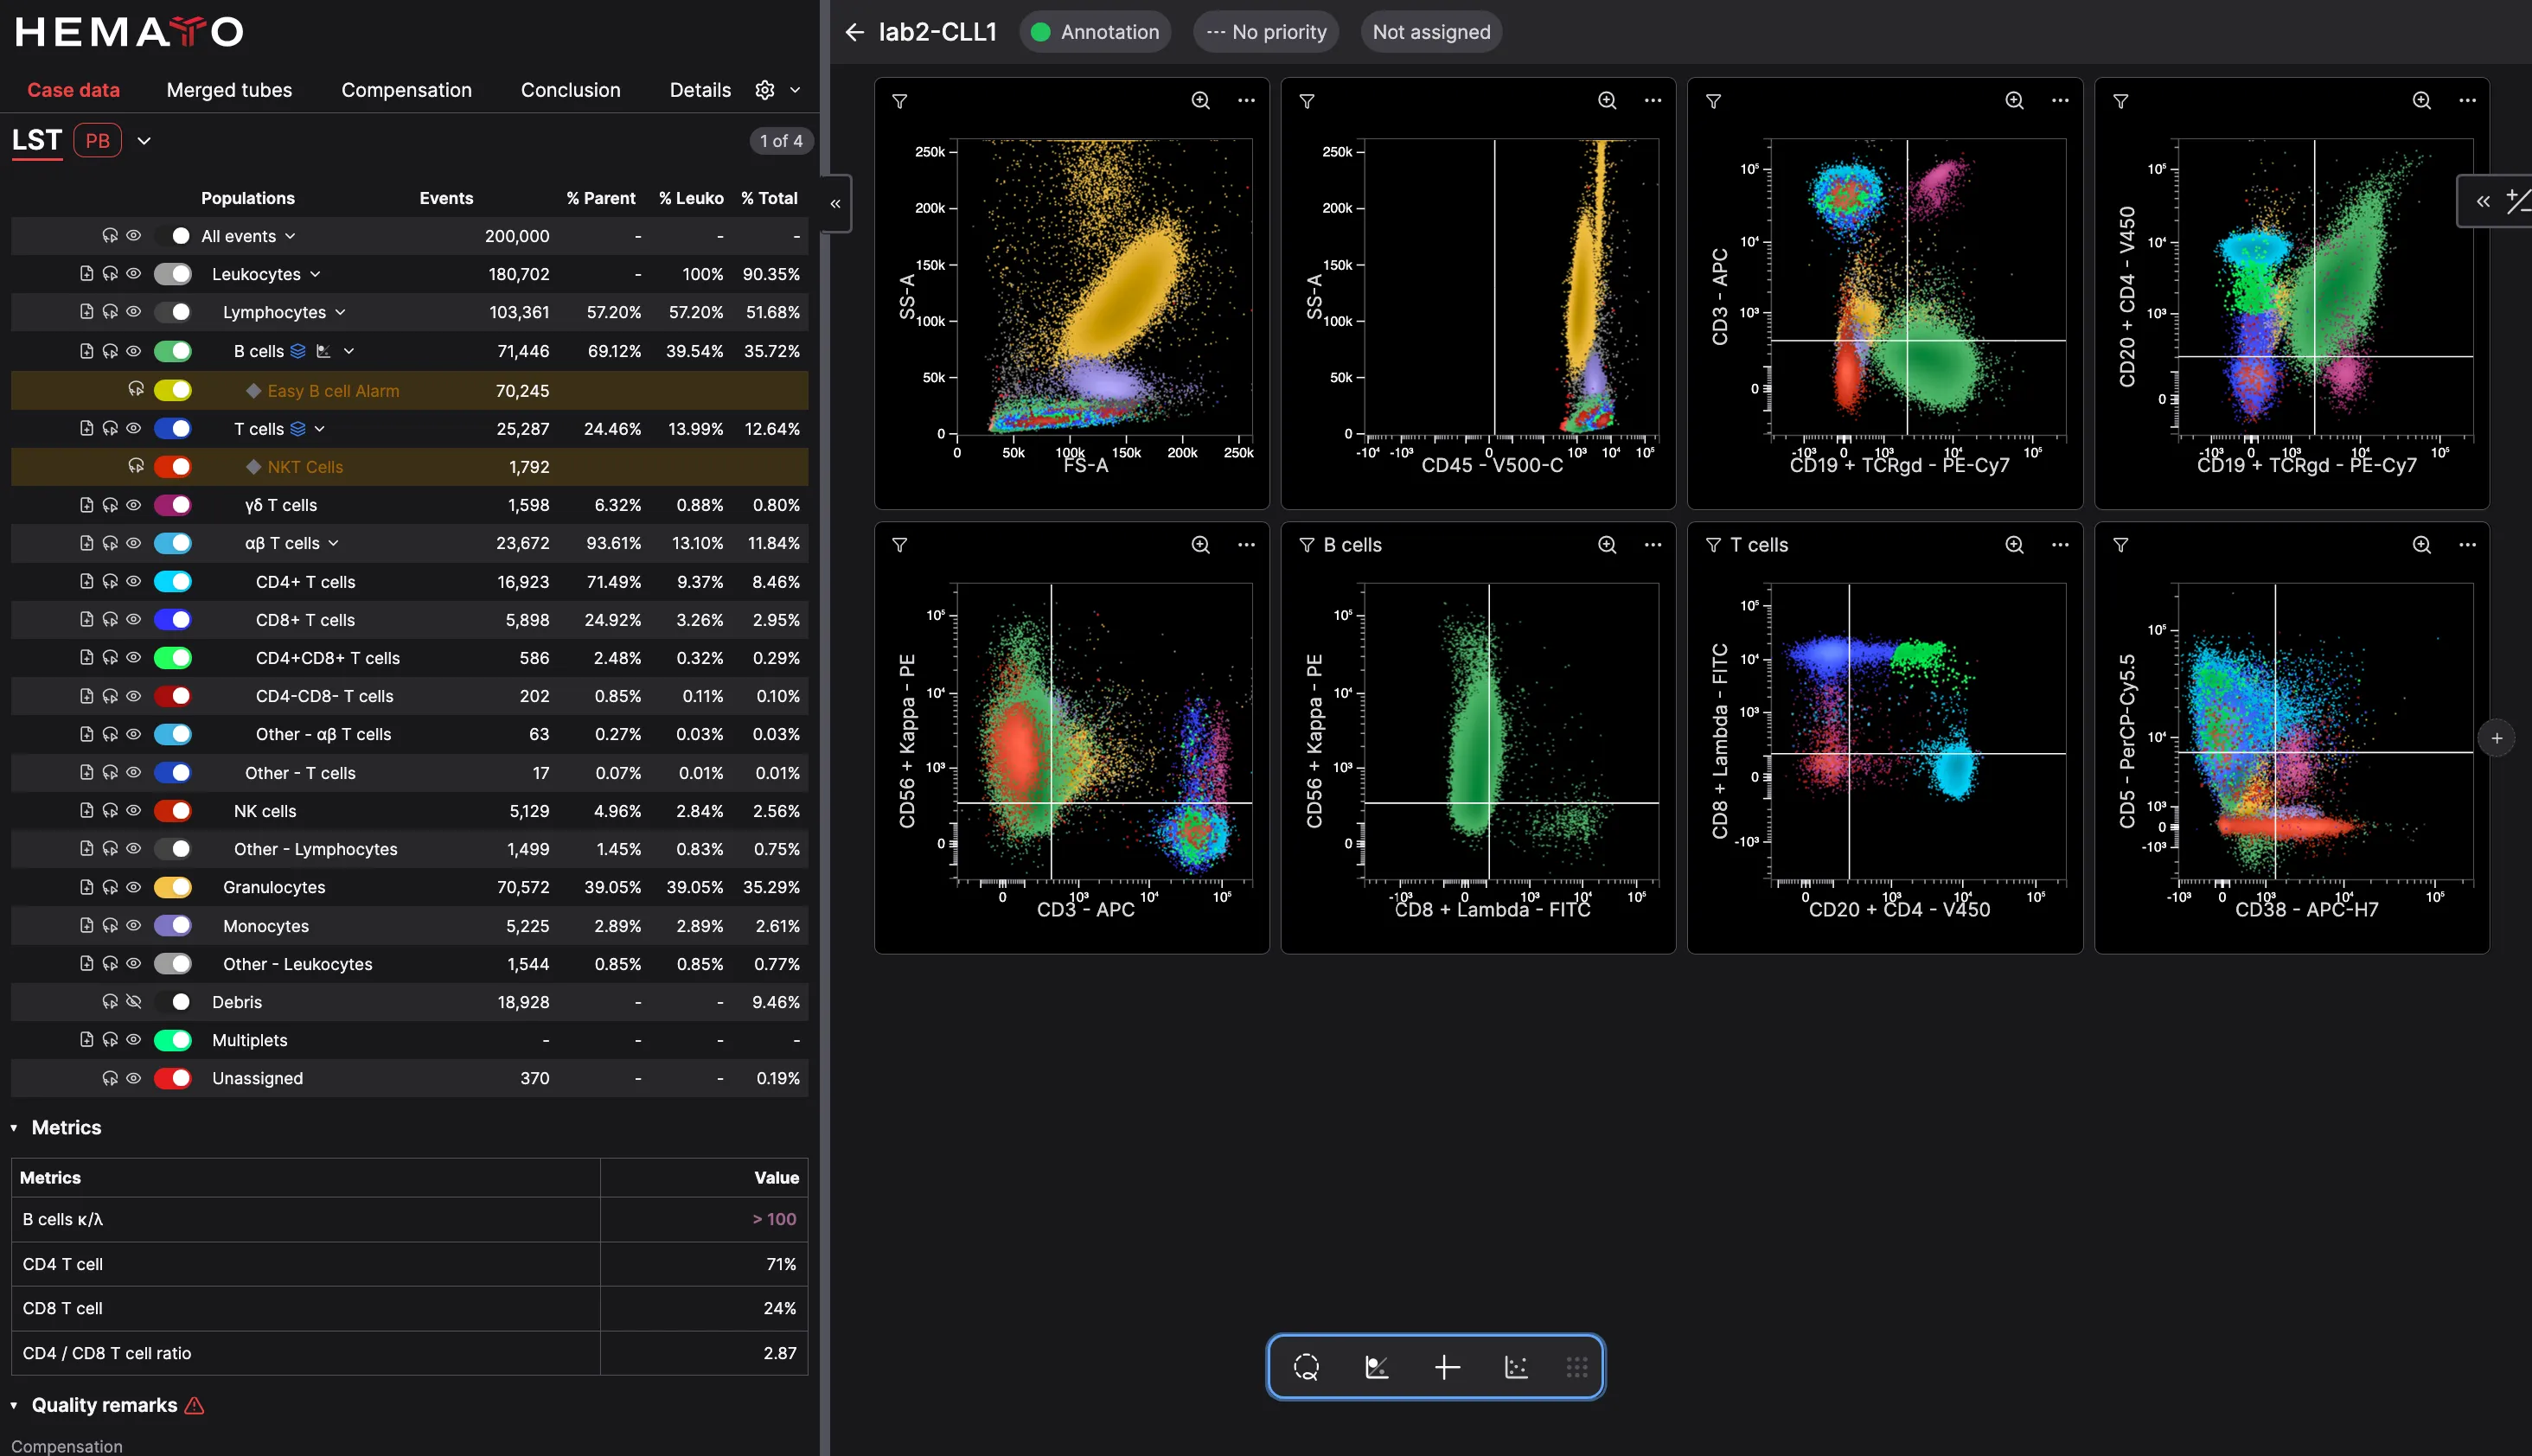
  • CellStudio analysis showing AI-predicted cell populations and a color-coded scatter plot

    AI cell predictions

    CellStudio predicts a cell type for every cell in a case. Automated clustering can optionally be applied for supported cell types.

    CellStudio analysis showing AI-predicted cell populations and a color-coded scatter plot
  • CellStudio scatter plot with adjustable phenotype thresholds and a table of marker expression statistics

    Fine-grained phenotypes

    Define a target population and see its detailed phenotype and statistics. Watch it update in real time as you annotate with CellStudio’s lasso and threshold tools.

    CellStudio scatter plot with adjustable phenotype thresholds and a table of marker expression statistics
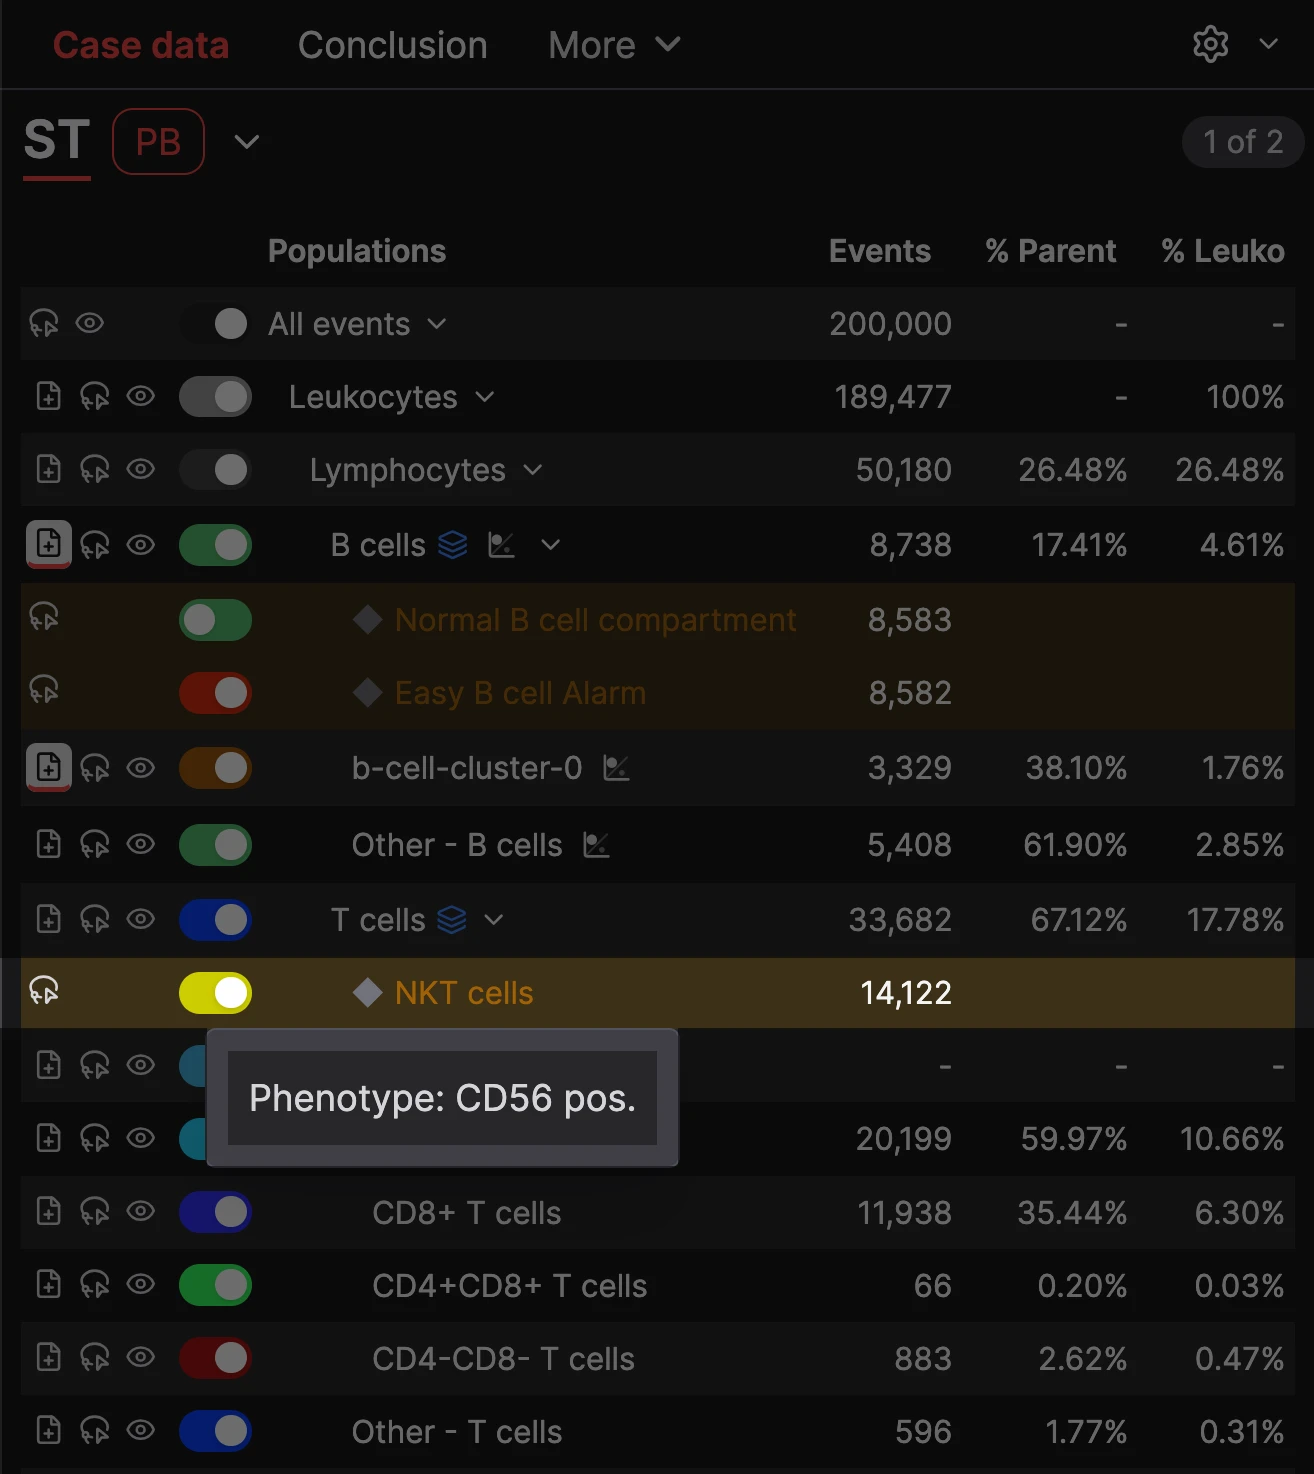
  • Cell Tree highlighting NKT cells identified by a CD56-positive phenotype

    Phenotype-based subsets

    You can configure subsets based on a cell type and phenotype that will be automatically identified and added to your Cell Tree.

    Cell Tree highlighting NKT cells identified by a CD56-positive phenotype
  • CellStudio Case Flags with details of a phenotype-based Flag Rule for possible DLBCL CD10+

    Case Flags

    Cases are automatically flagged based on cell population and phenotype criteria. Hema.to comes with a full WHO-based catalogue of Flag Rules that can be added to your app with one click.

    CellStudio Case Flags with details of a phenotype-based Flag Rule for possible DLBCL CD10+
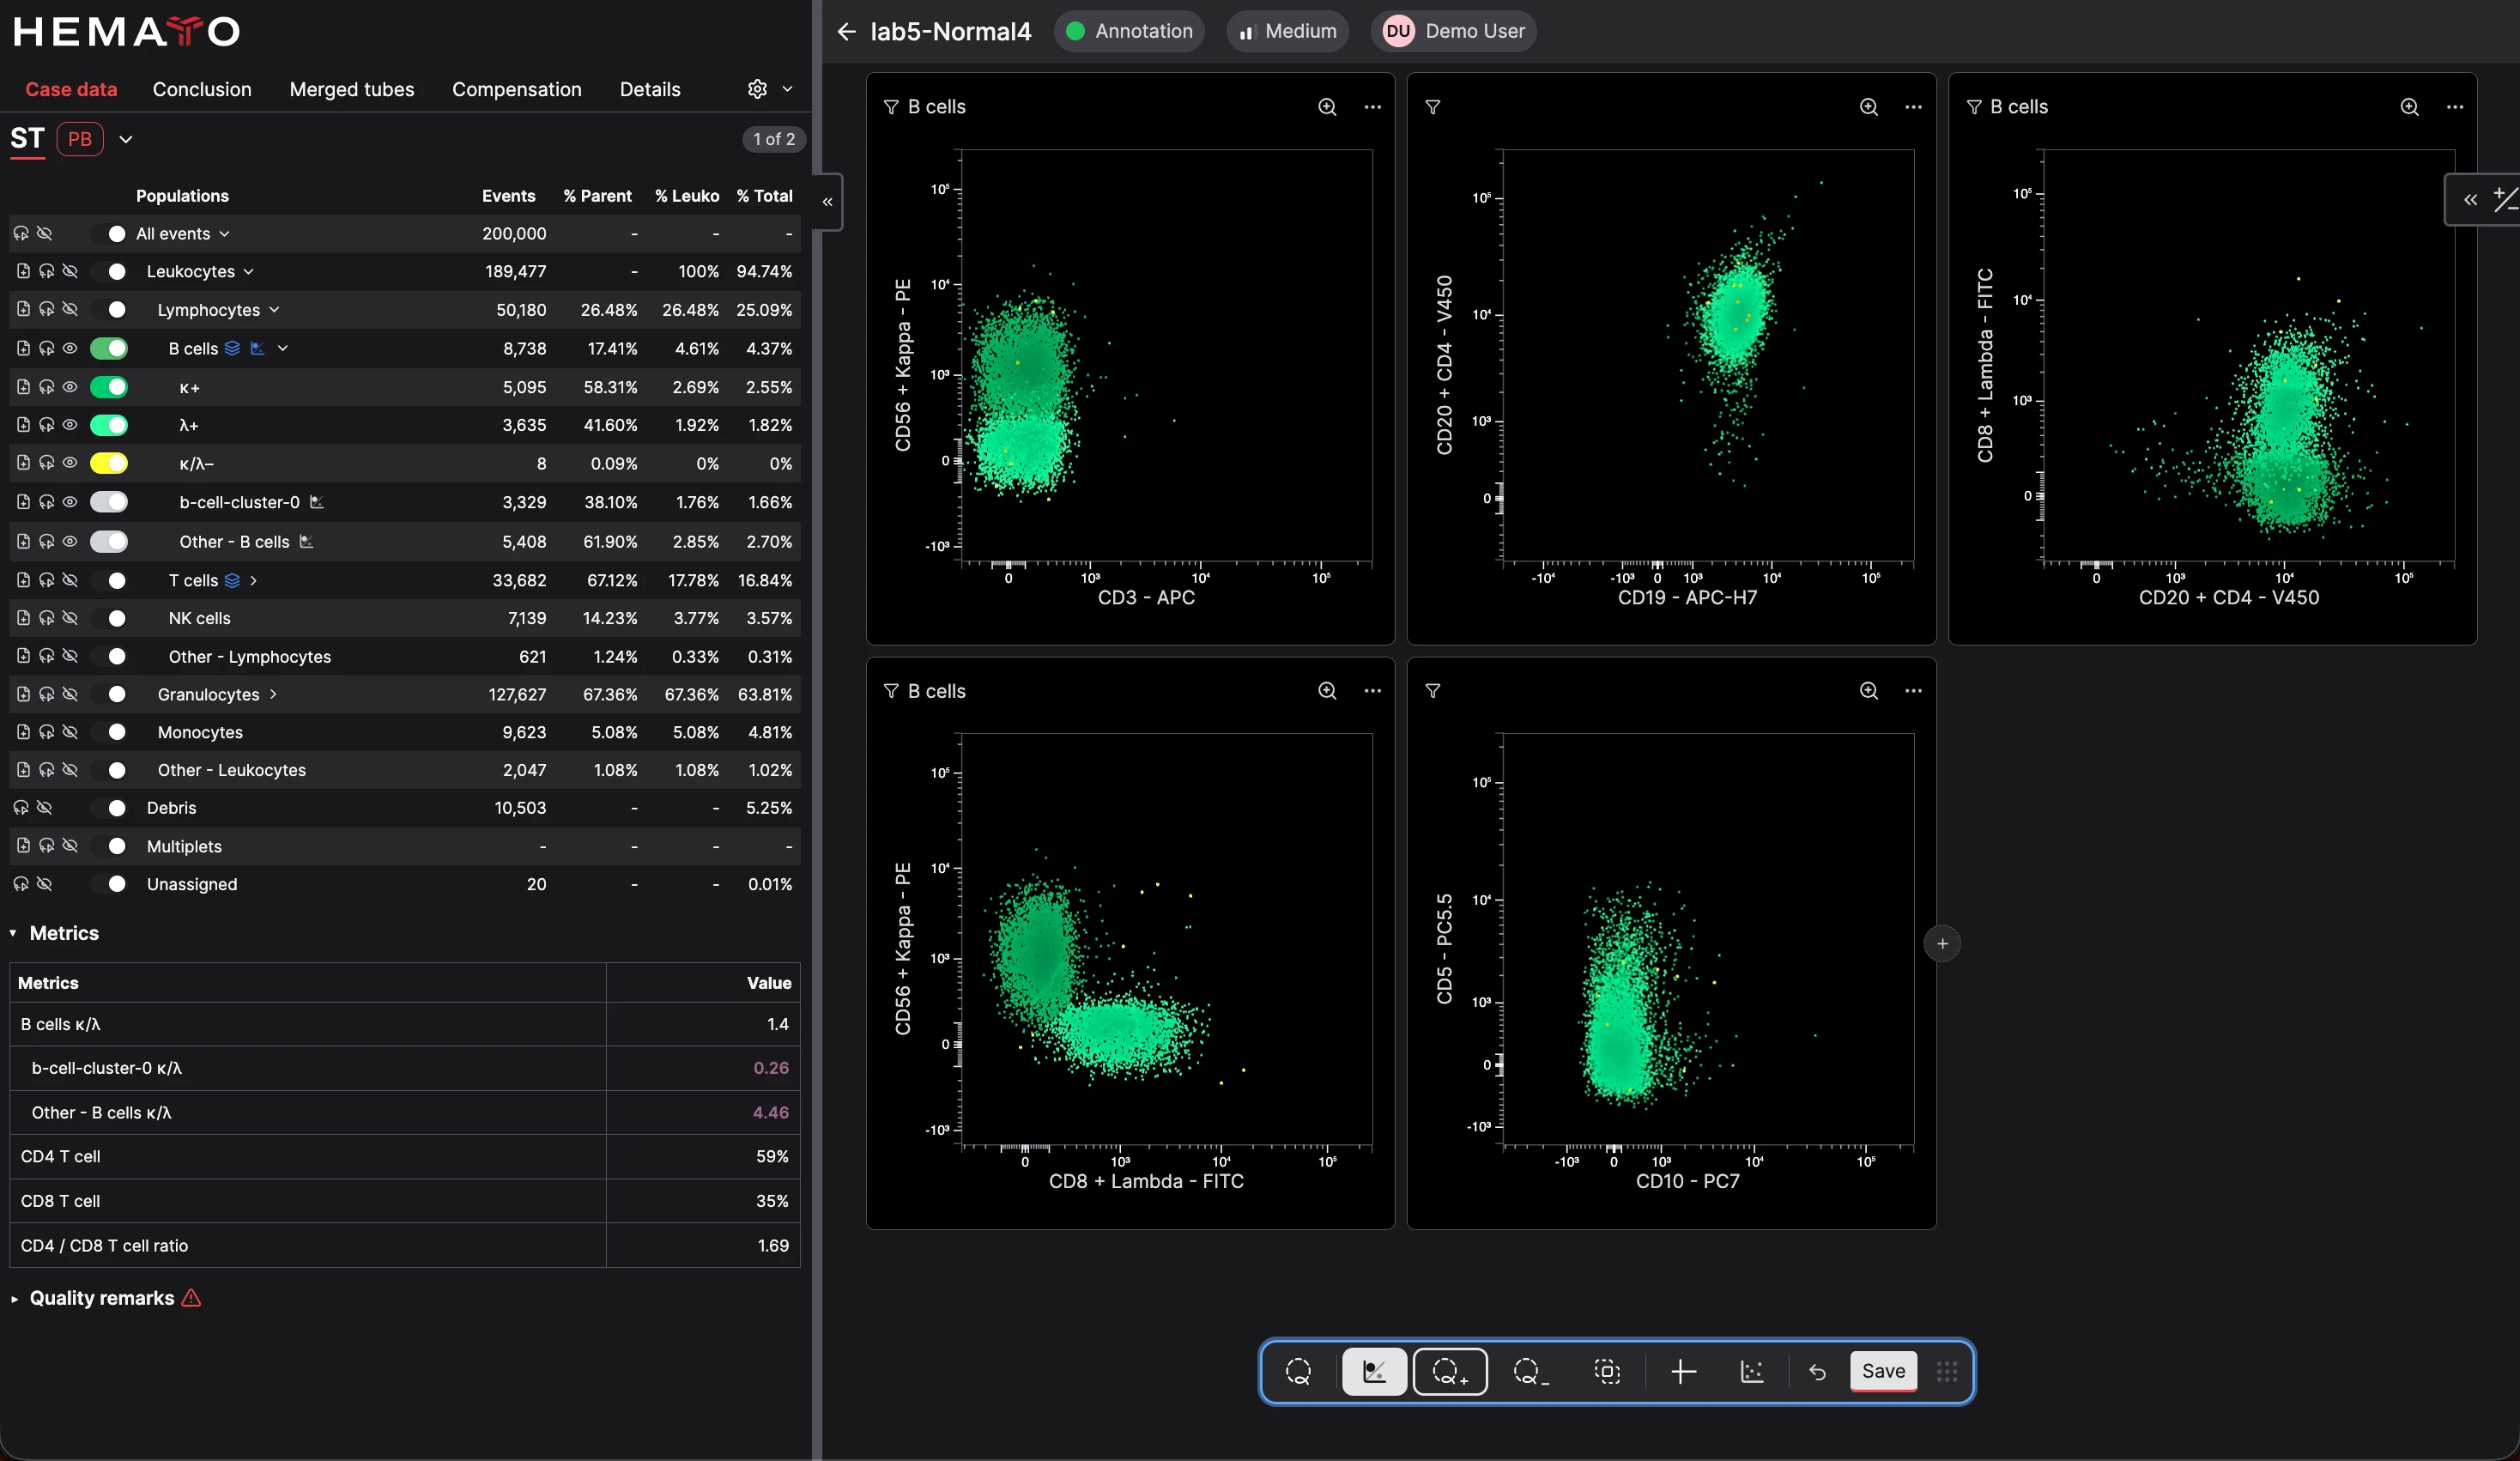
  • CellStudio analysis showing kappa and lambda clonality scatter plots for several B-cell populations

    Clonality labels

    Kappa and lambda clonality is automatically assessed for B cells and their subpopulations. Detailed clonality statistics are available on a population level and can be referenced in reports.

    CellStudio analysis showing kappa and lambda clonality scatter plots for several B-cell populations

Advanced data analysis tools when you need them.

  • Seamless editing

    CellStudio features a rich, intuitive suite of manual data analysis tools for flow cytometry that scales to millions of events per tube.

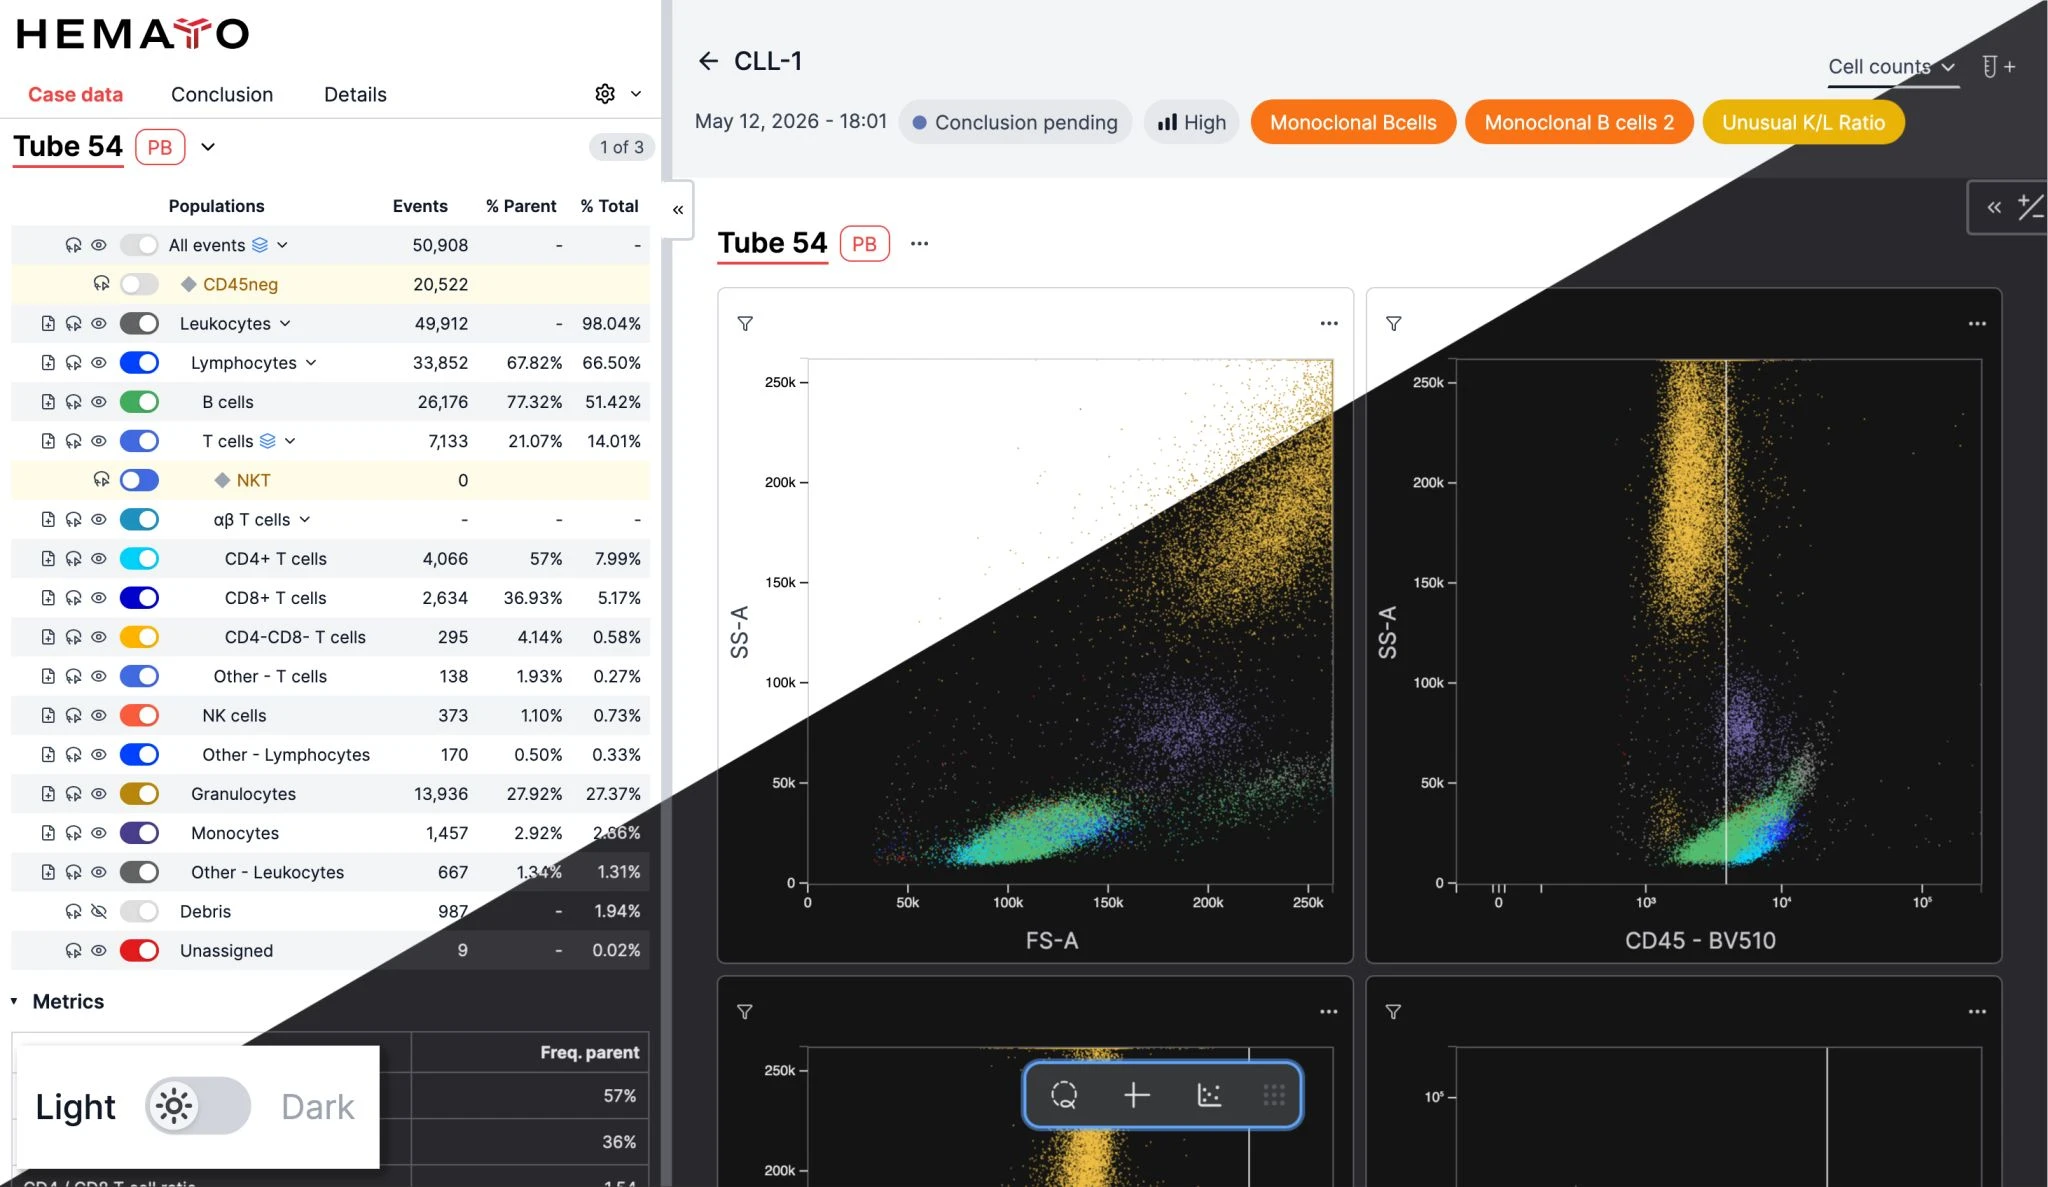
  • CellStudio case analysis shown in light and dark themes with customized population colors

    Customizable color palette

    CellStudio is available in both a light and dark theme. You can customize the color of every cell population for either mode in your user settings.

    CellStudio case analysis shown in light and dark themes with customized population colors
  • Flexible scatter plots

    Scatter plots can display data in linear, log and symlog scale. Axis parameters can be reconfigured seamlessly while analyzing a case.

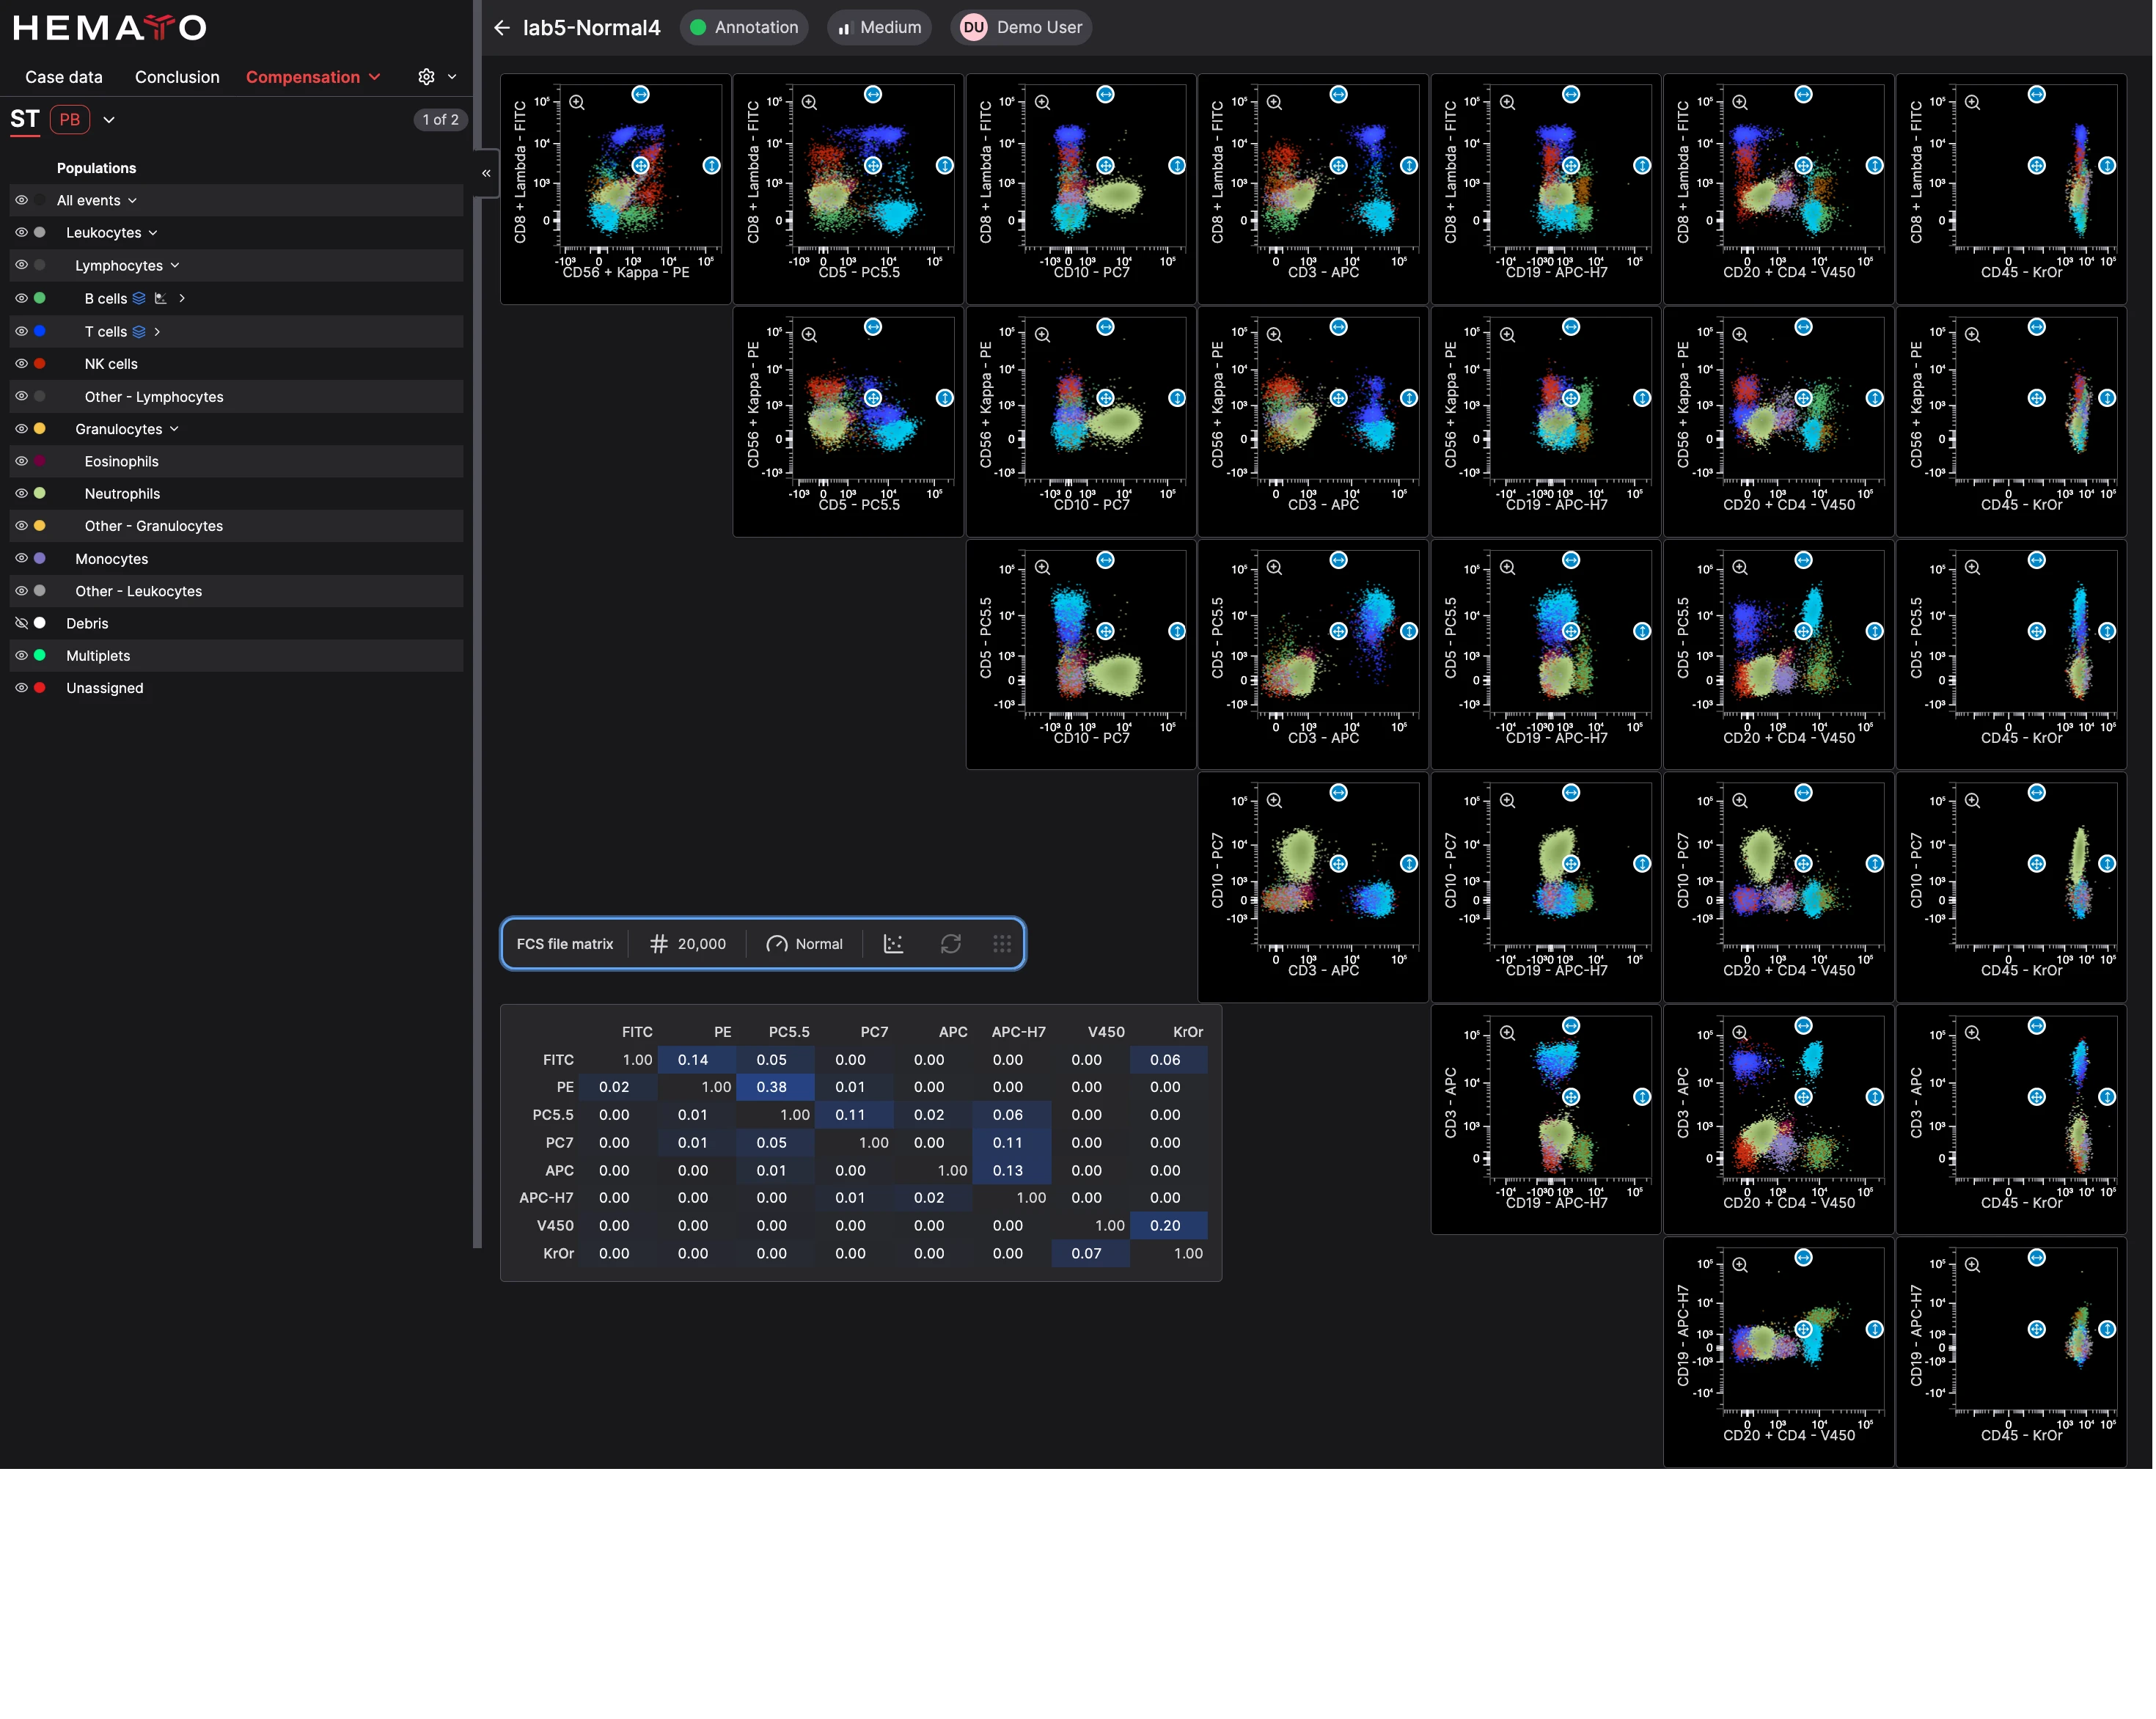
  • CellStudio compensation editor showing a compensation matrix alongside a grid of color-coded scatter plots

    Adjustable compensation

    CellStudio features a visual editor for the case’s compensation matrix. Once changed, predictions can be rerun with the updated parameters with one click.

    CellStudio compensation editor showing a compensation matrix alongside a grid of color-coded scatter plots
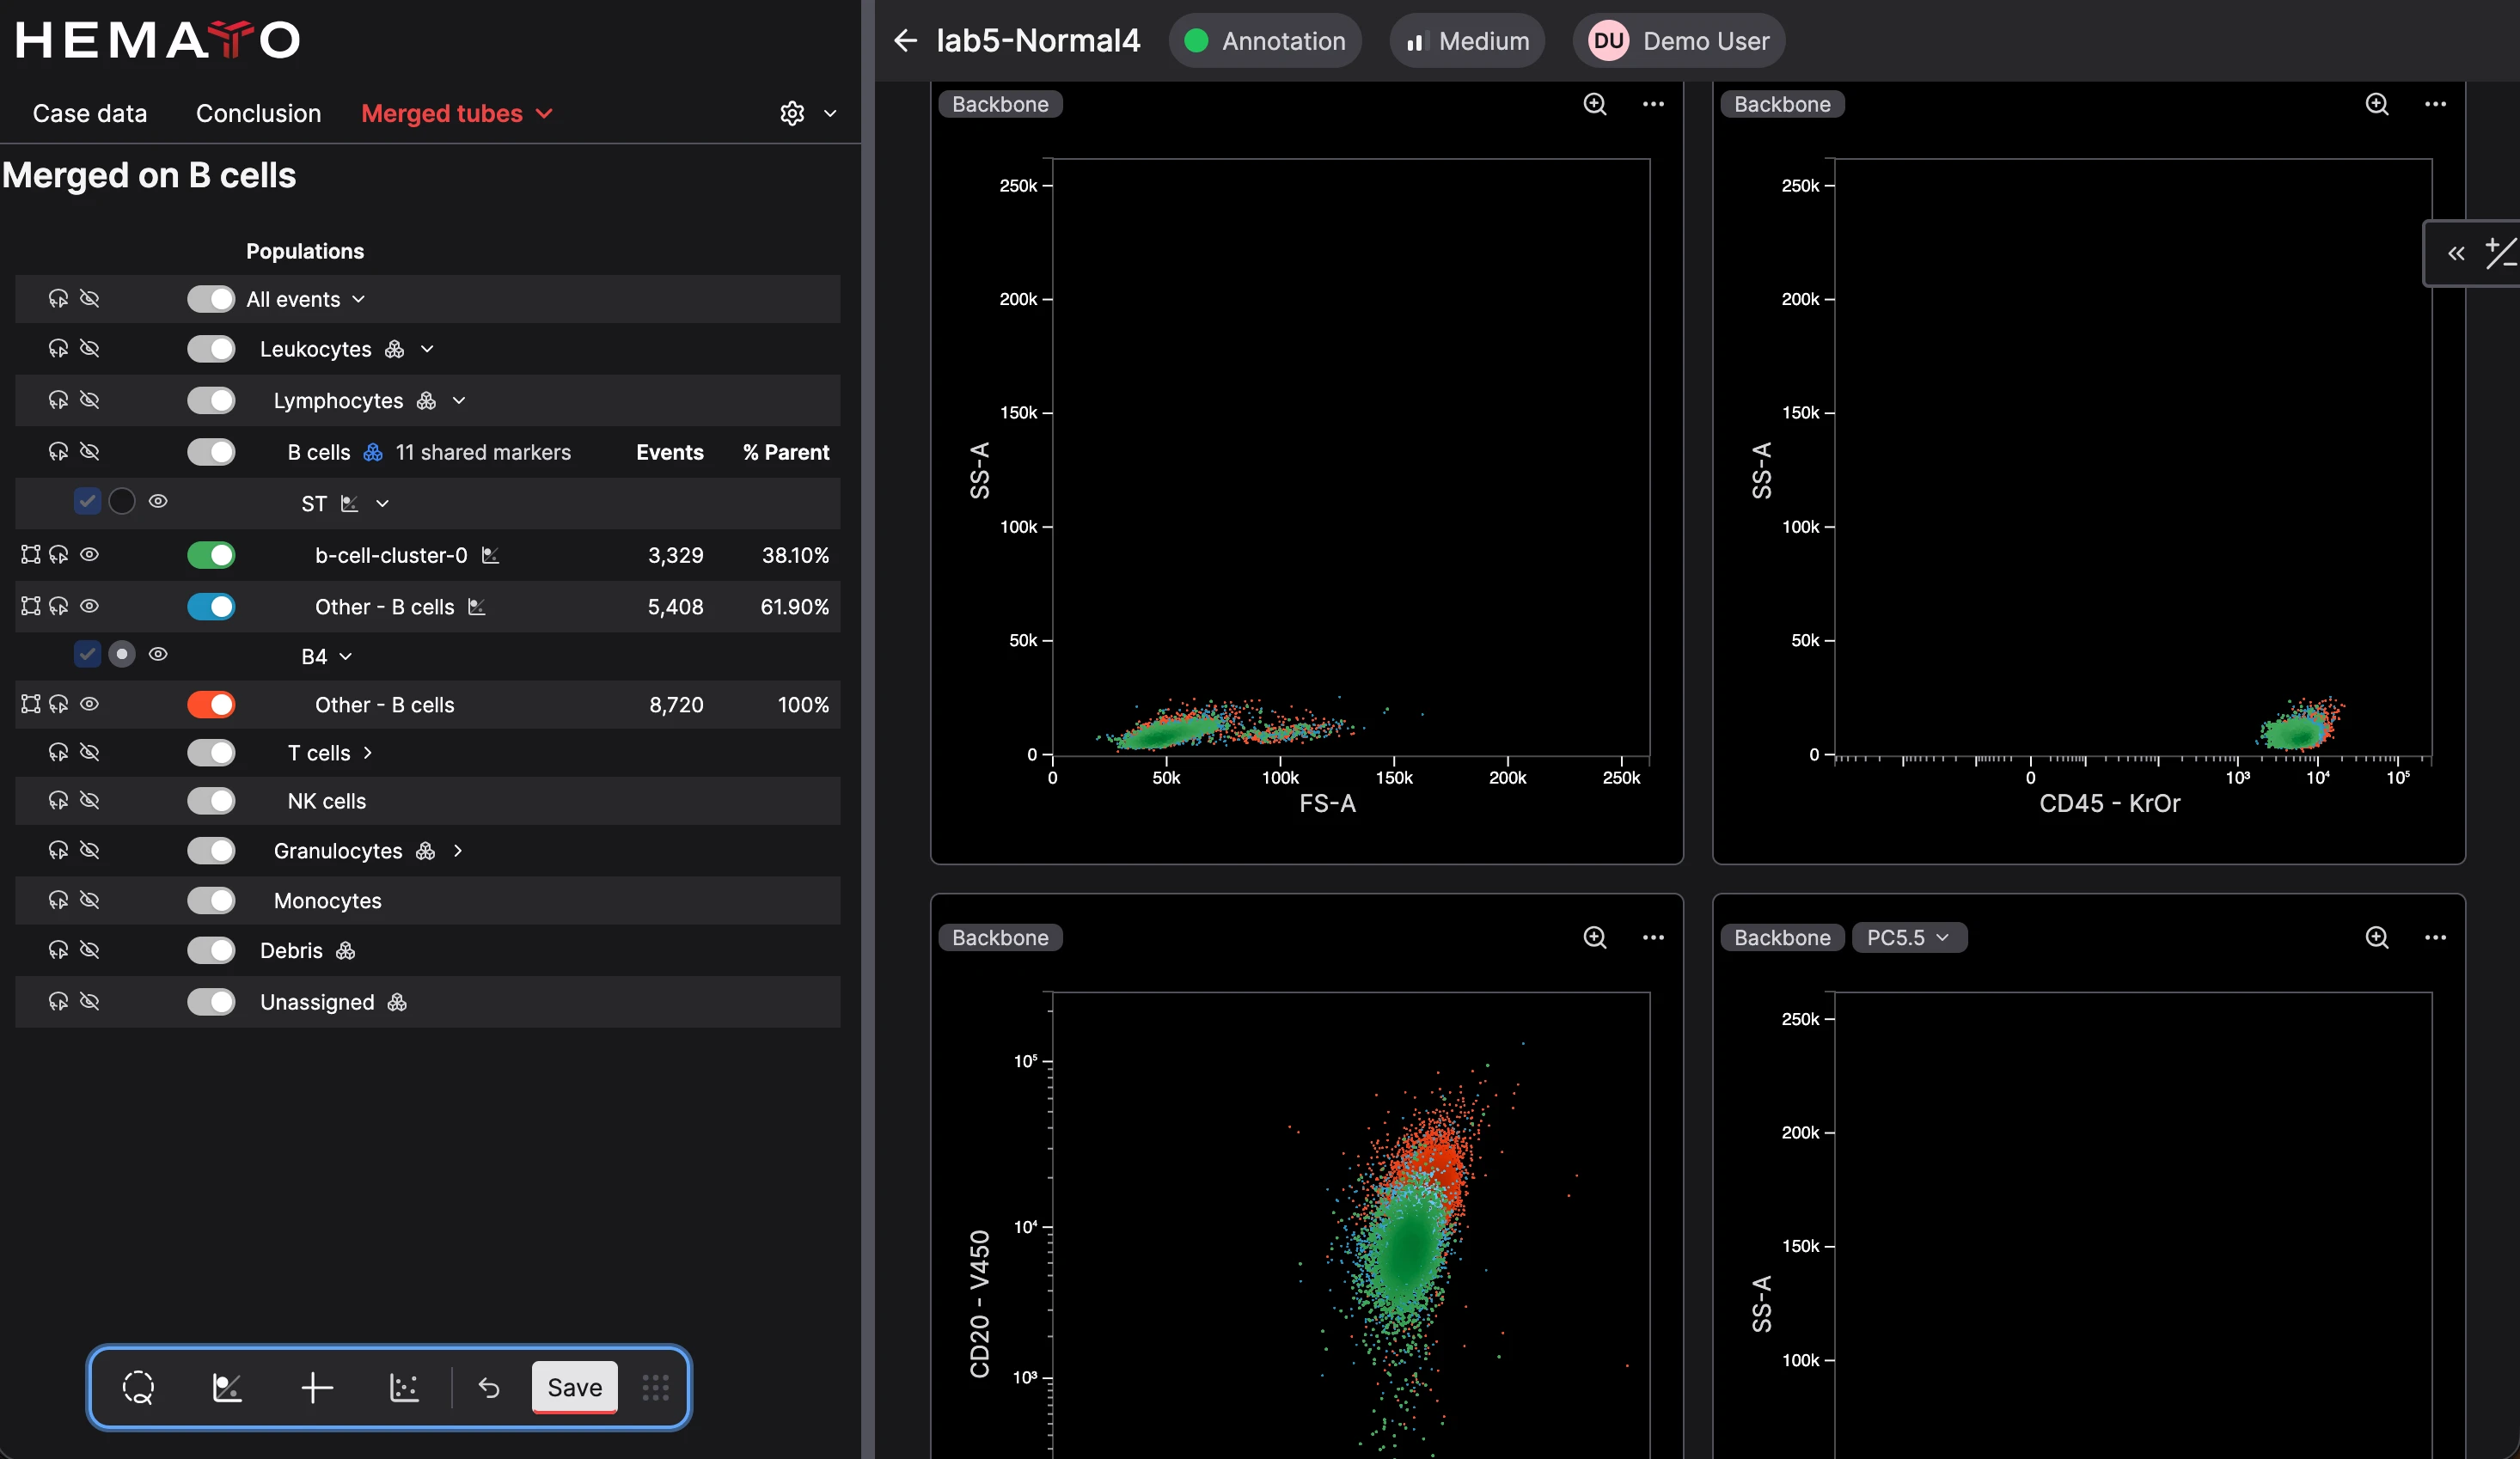
  • CellStudio Combined Tube showing aligned cell populations across four scatter plots

    Combined Tube

    Quickly align clusters across tubes with CellStudio’s Combined Tube. Combining is available for all cell populations and remembers your settings the next time you open a case with the same panel.

    CellStudio Combined Tube showing aligned cell populations across four scatter plots

Manage every case from start to finish.

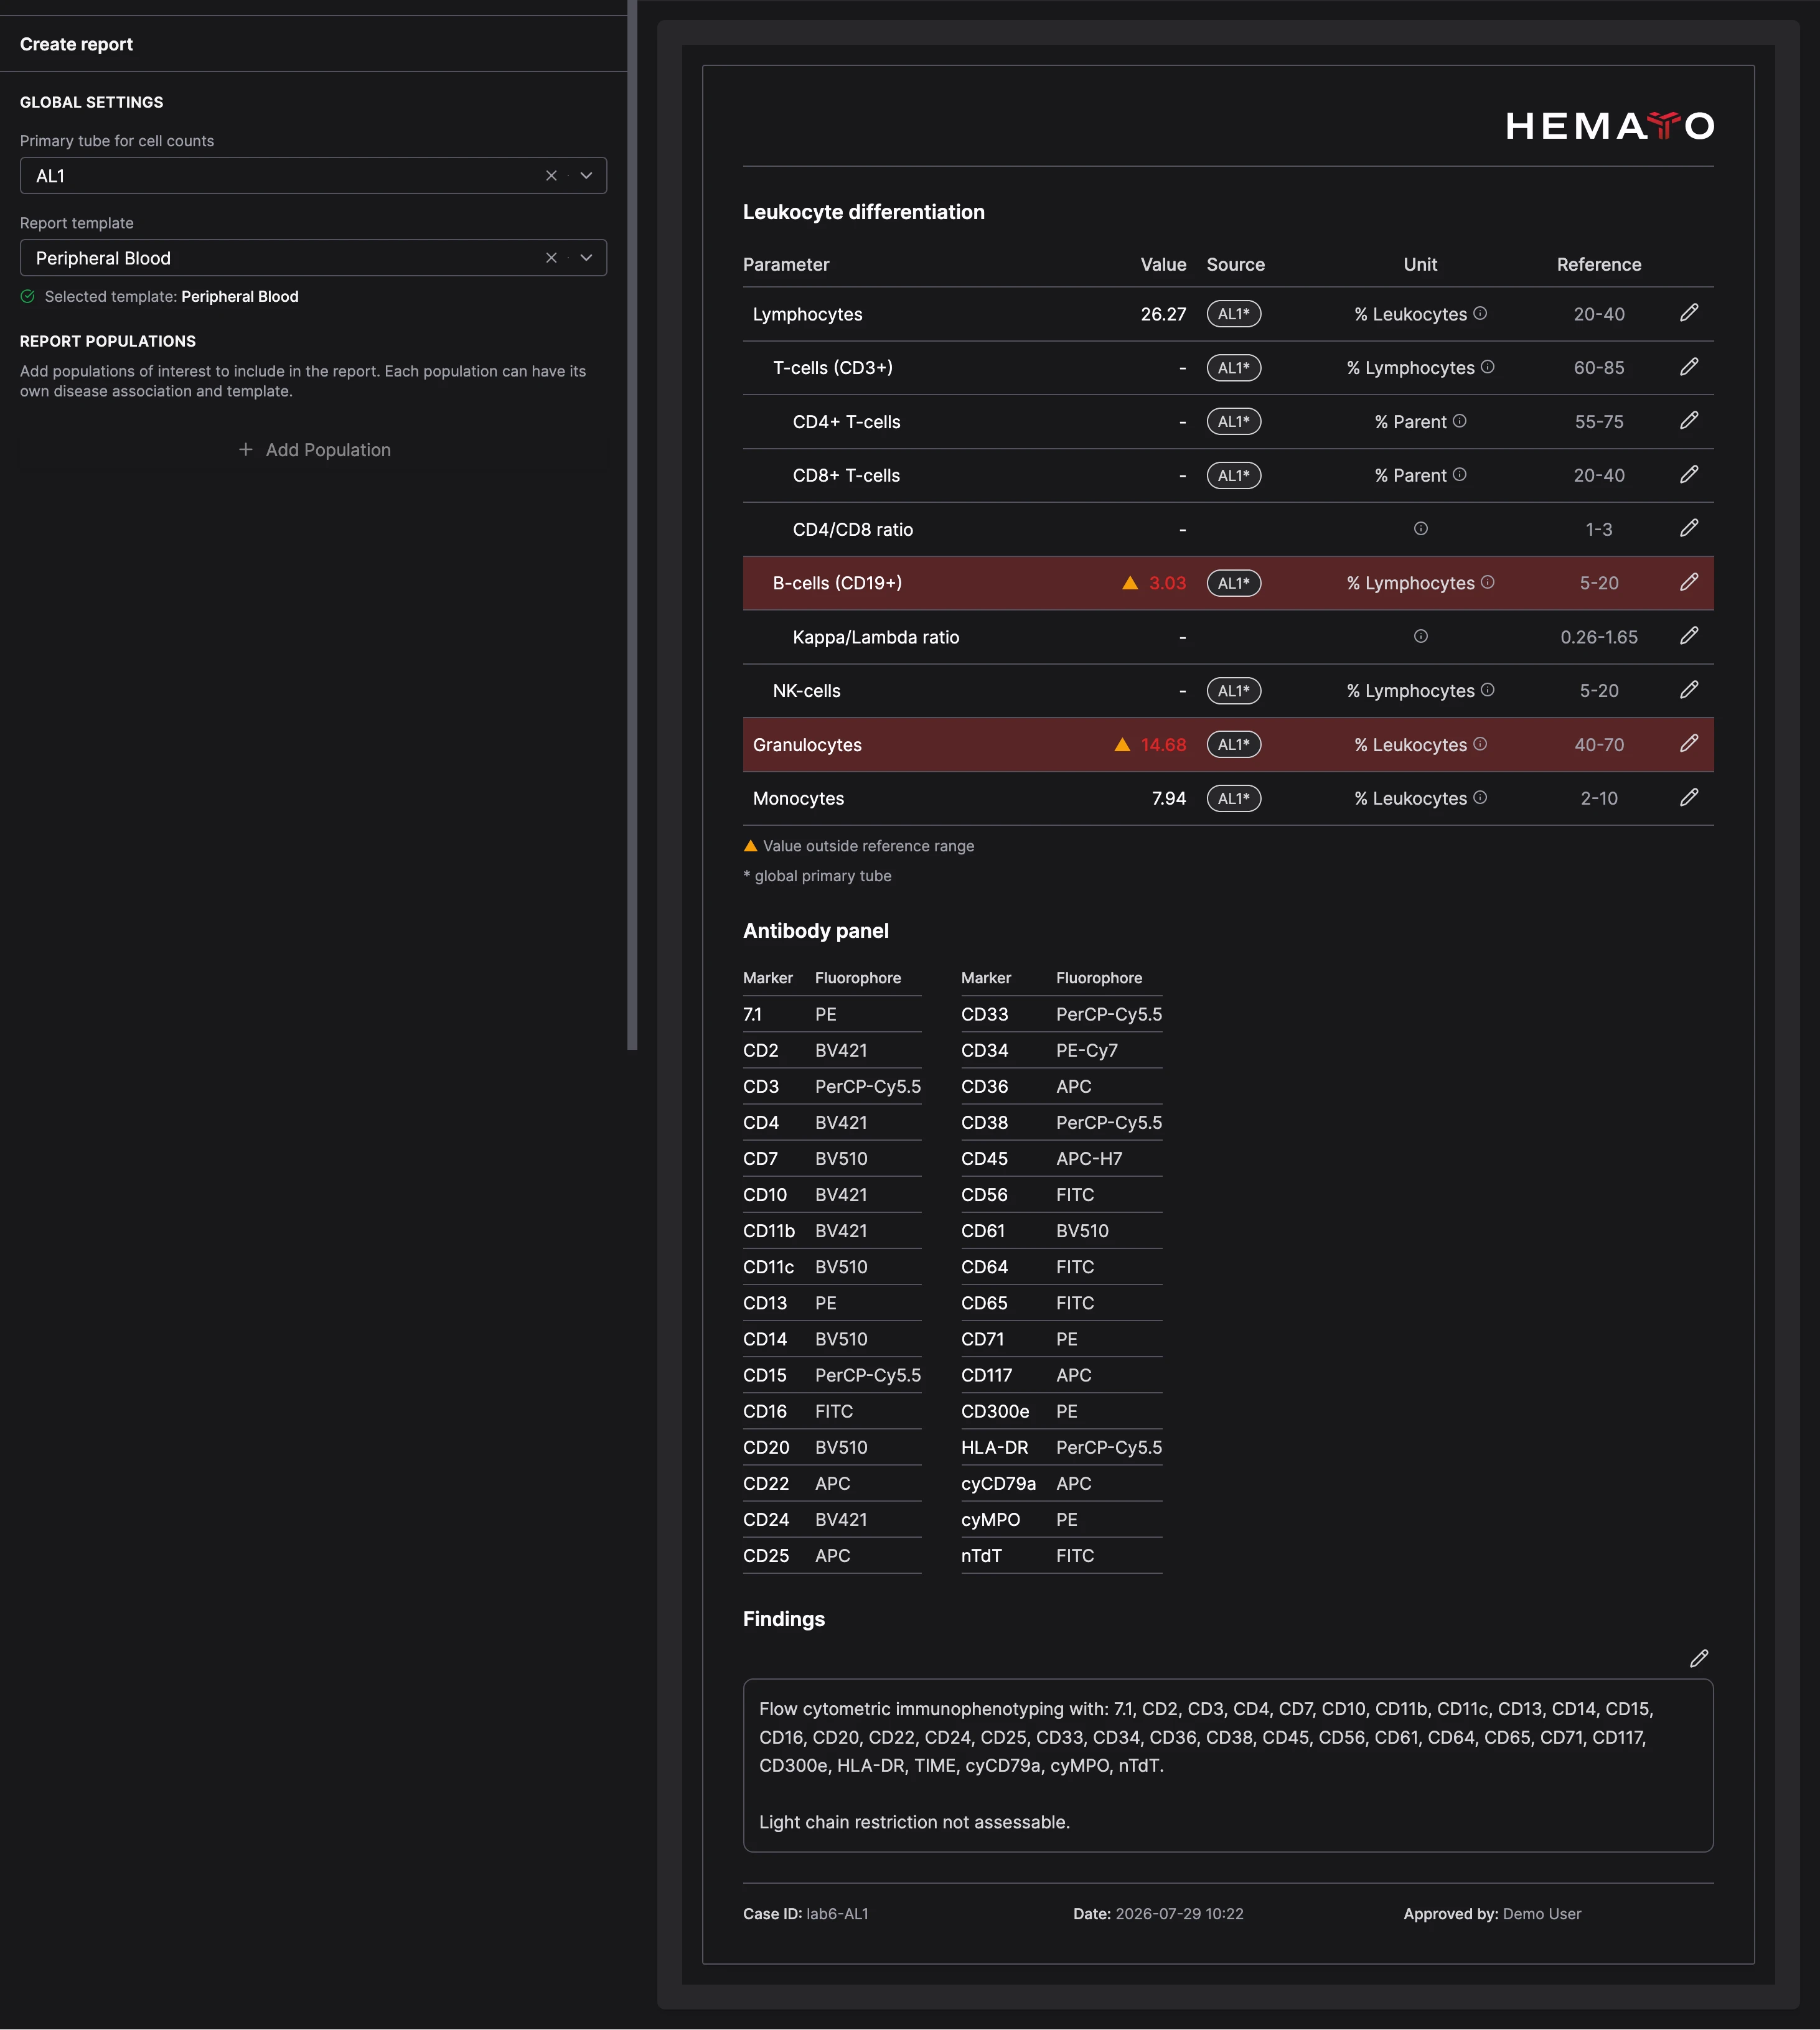
  • CellStudio Report tab previewing a leukocyte differentiation report with cell counts and findings

    Print-ready reports

    Define your Report Template for a panel or material once and have CellStudio create print-ready PDF reports with one click. CellStudio’s reports contain both free-form text as well as a detailed cell statistics section.

    CellStudio Report tab previewing a leukocyte differentiation report with cell counts and findings
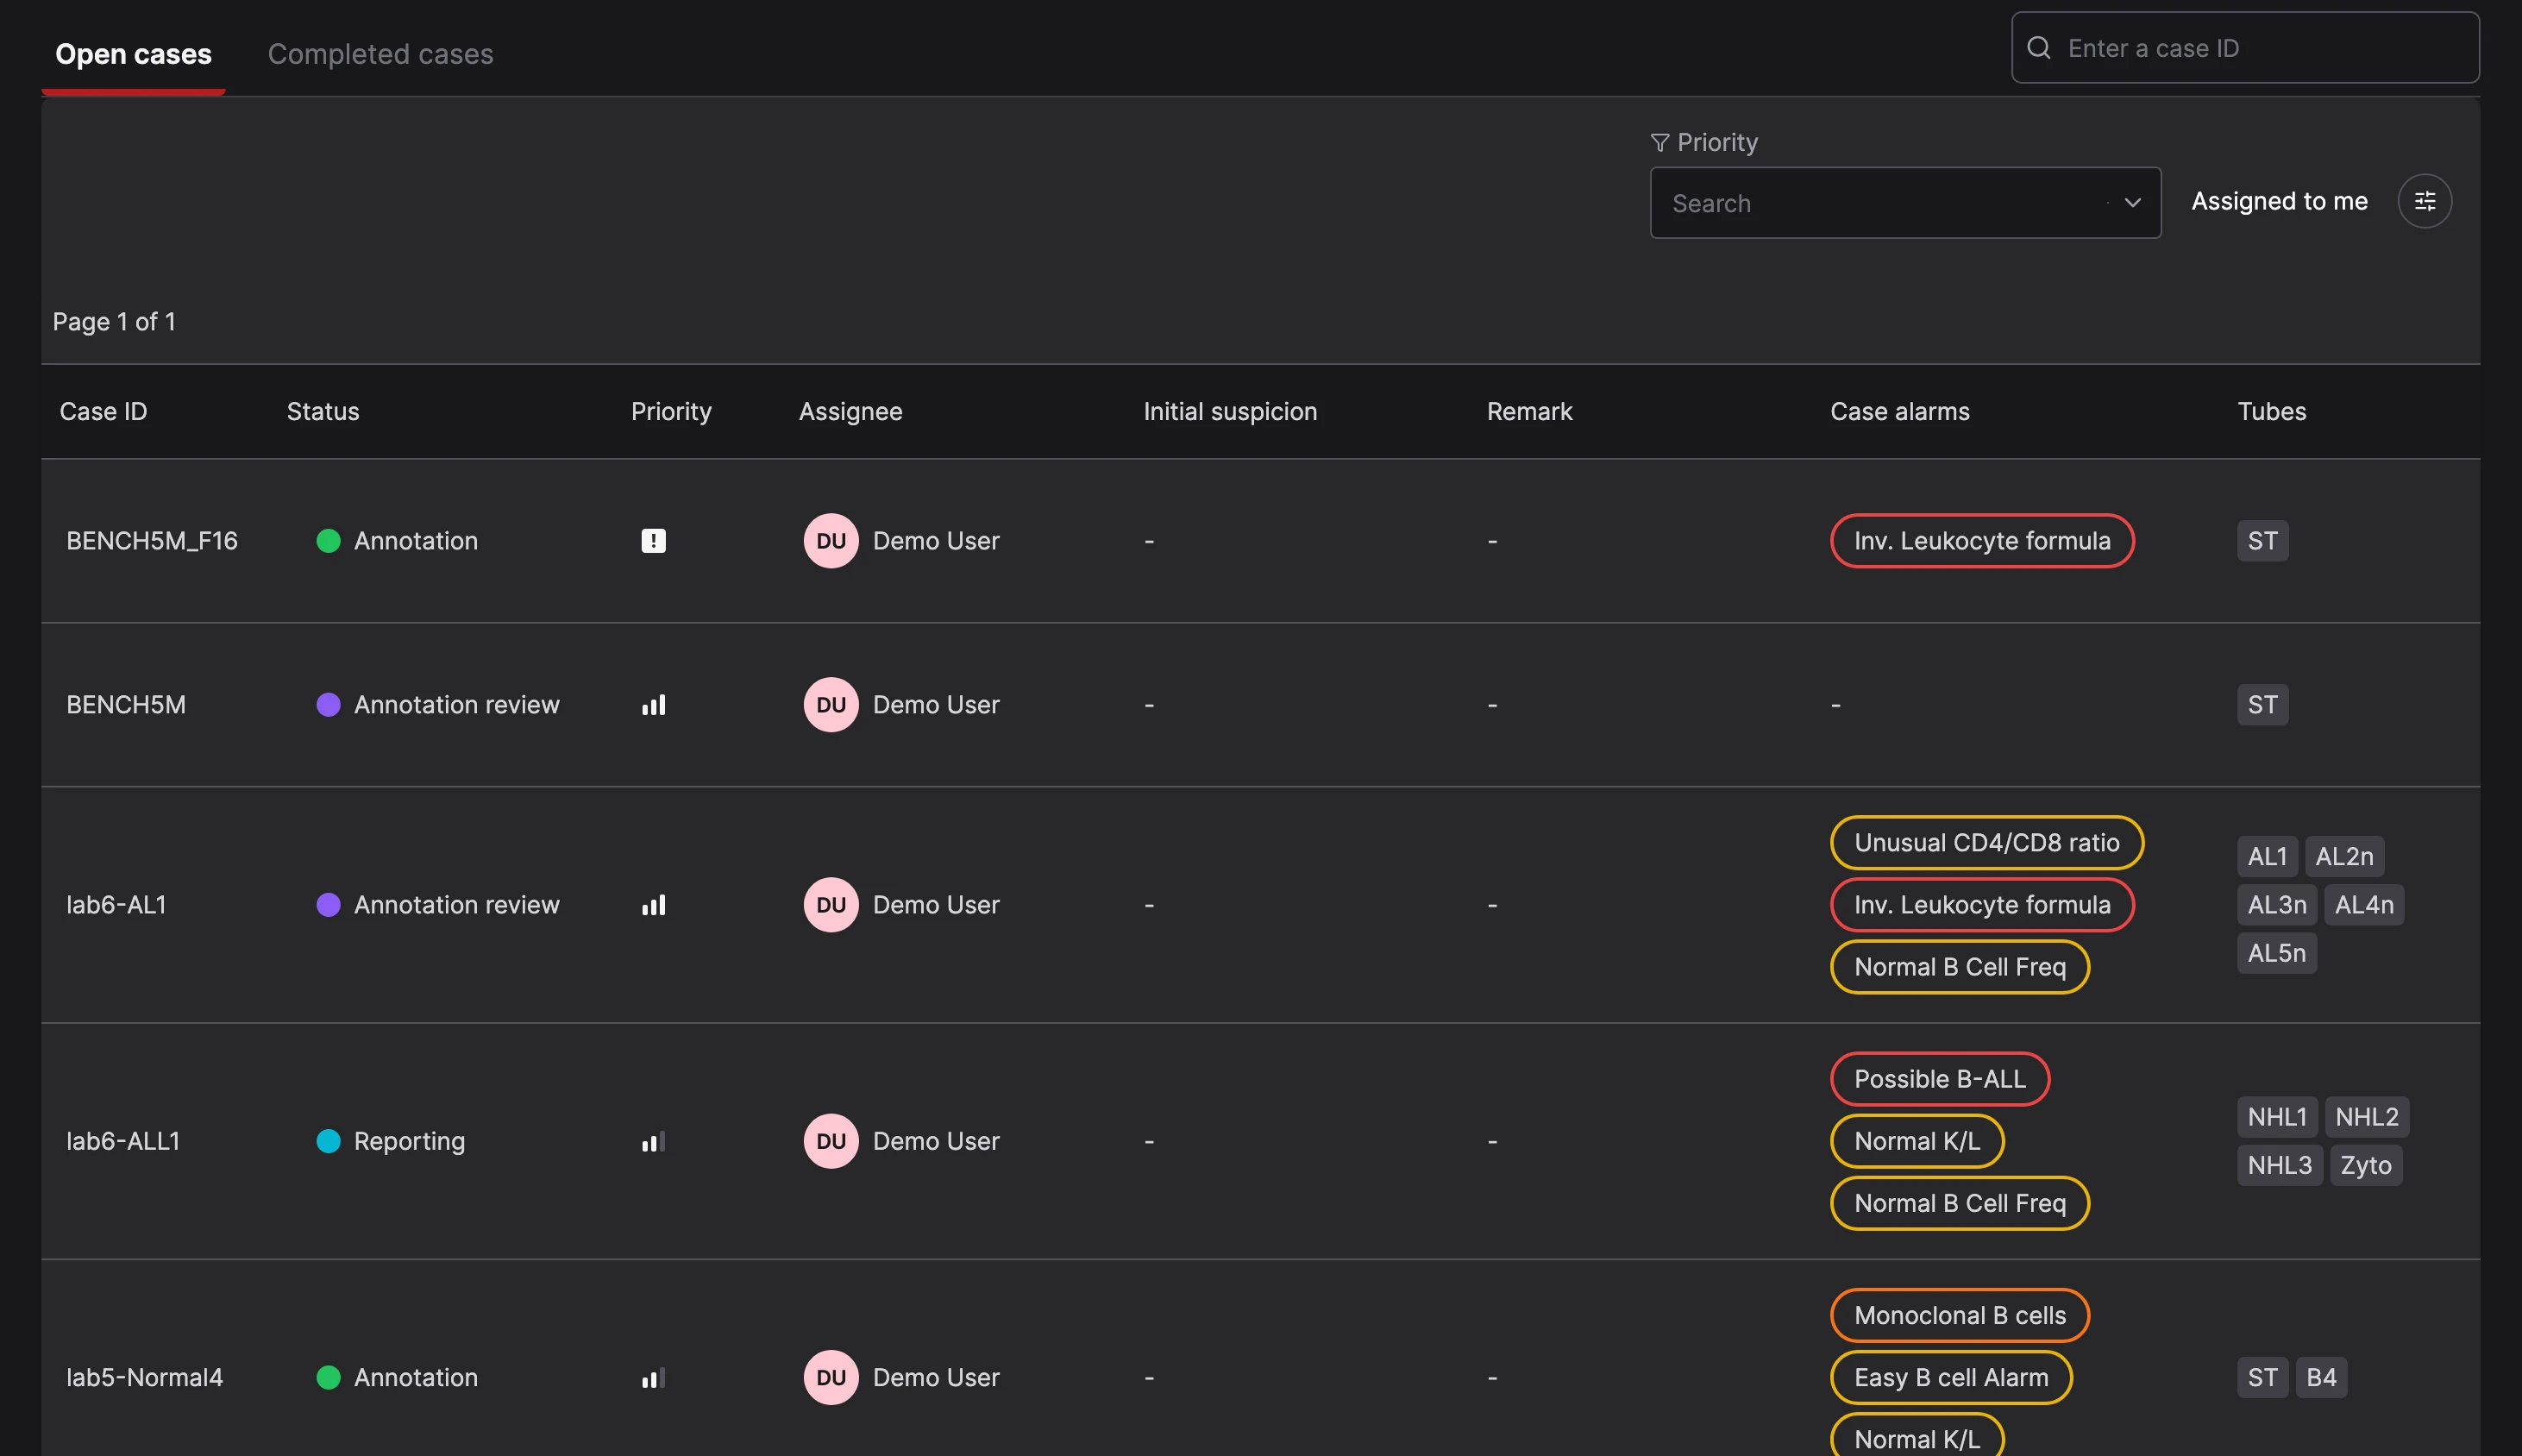
  • CellStudio Case List showing cases with their Workflow Status, priority, assignee, Flags, and tubes

    Dashboard overview

    See and manage your team’s Case List in one central place.

    CellStudio Case List showing cases with their Workflow Status, priority, assignee, Flags, and tubes
  • Case header showing Workflow Status, high priority, and assignment to a user

    Case priority & assignment

    Track which cases are important and who is working on them with case priorities and assignments. Filter the Case List to see your most important to-dos.

    Case header showing Workflow Status, high priority, and assignment to a user
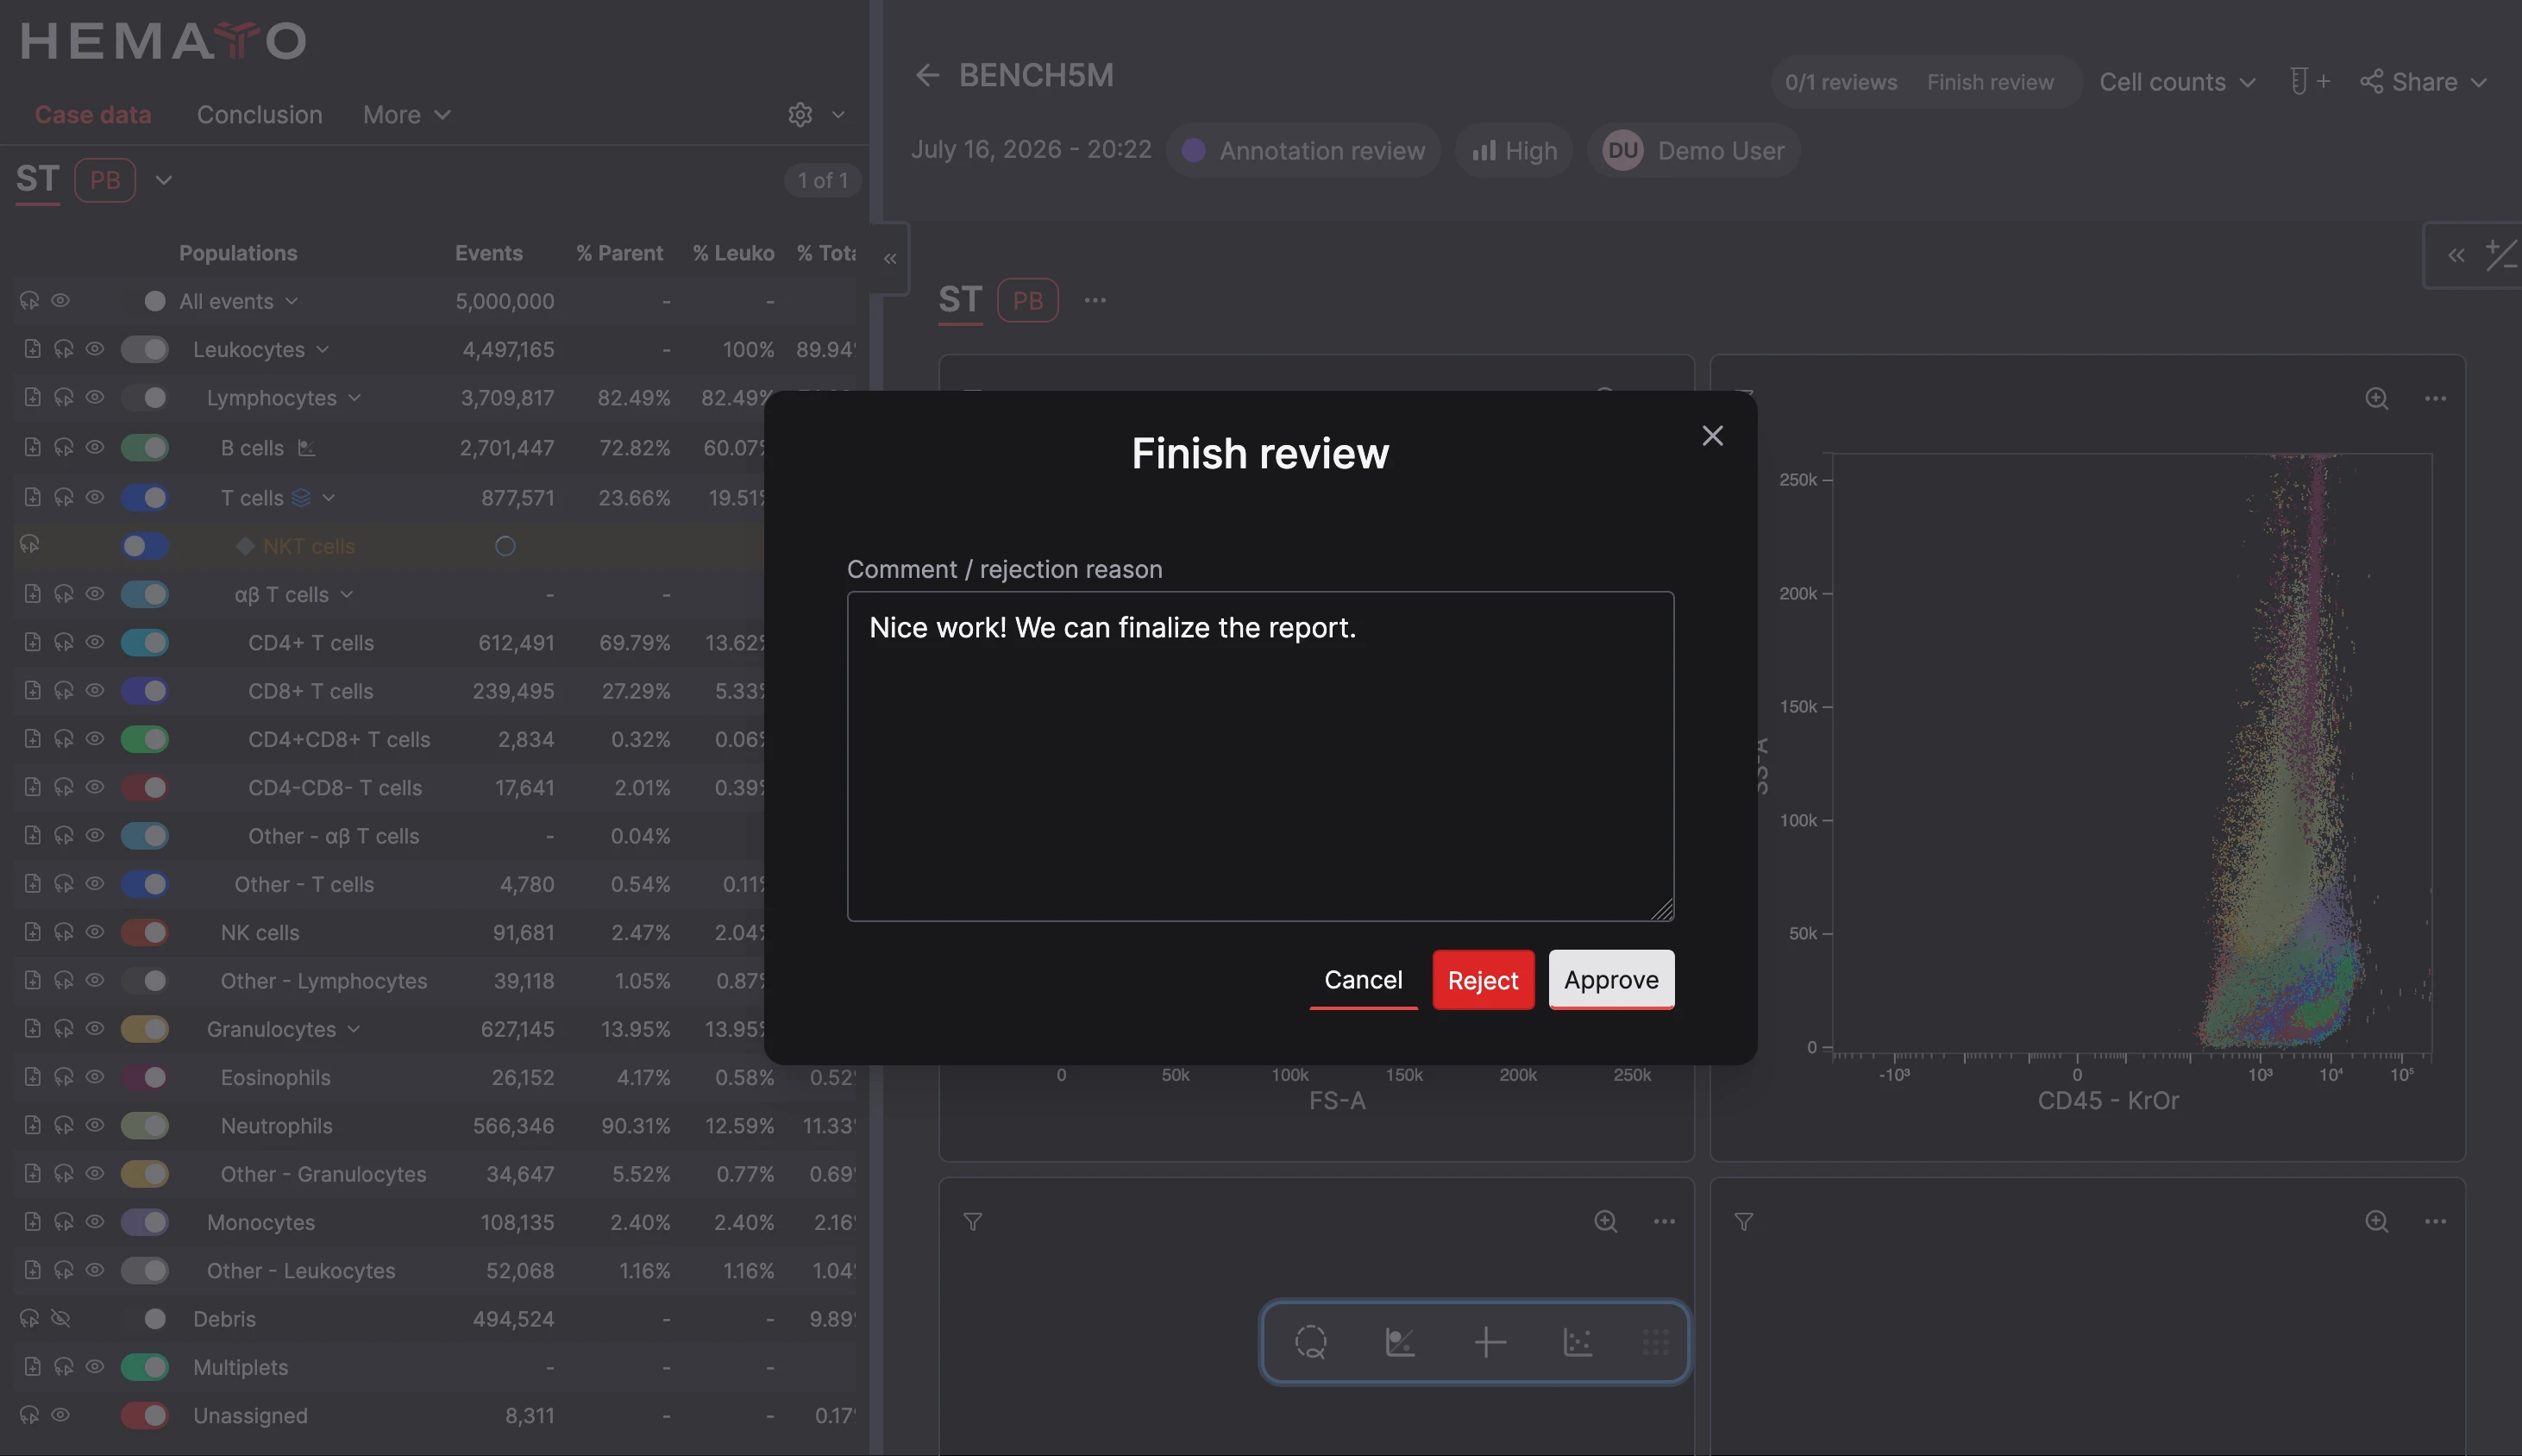
  • CellStudio review dialog with a comment and controls to reject or approve a case analysis

    Four-eyes principle reviews

    CellStudio can be configured to enforce review steps for annotations and reports to implement four-eyes principle quality controls.

    CellStudio review dialog with a comment and controls to reject or approve a case analysis
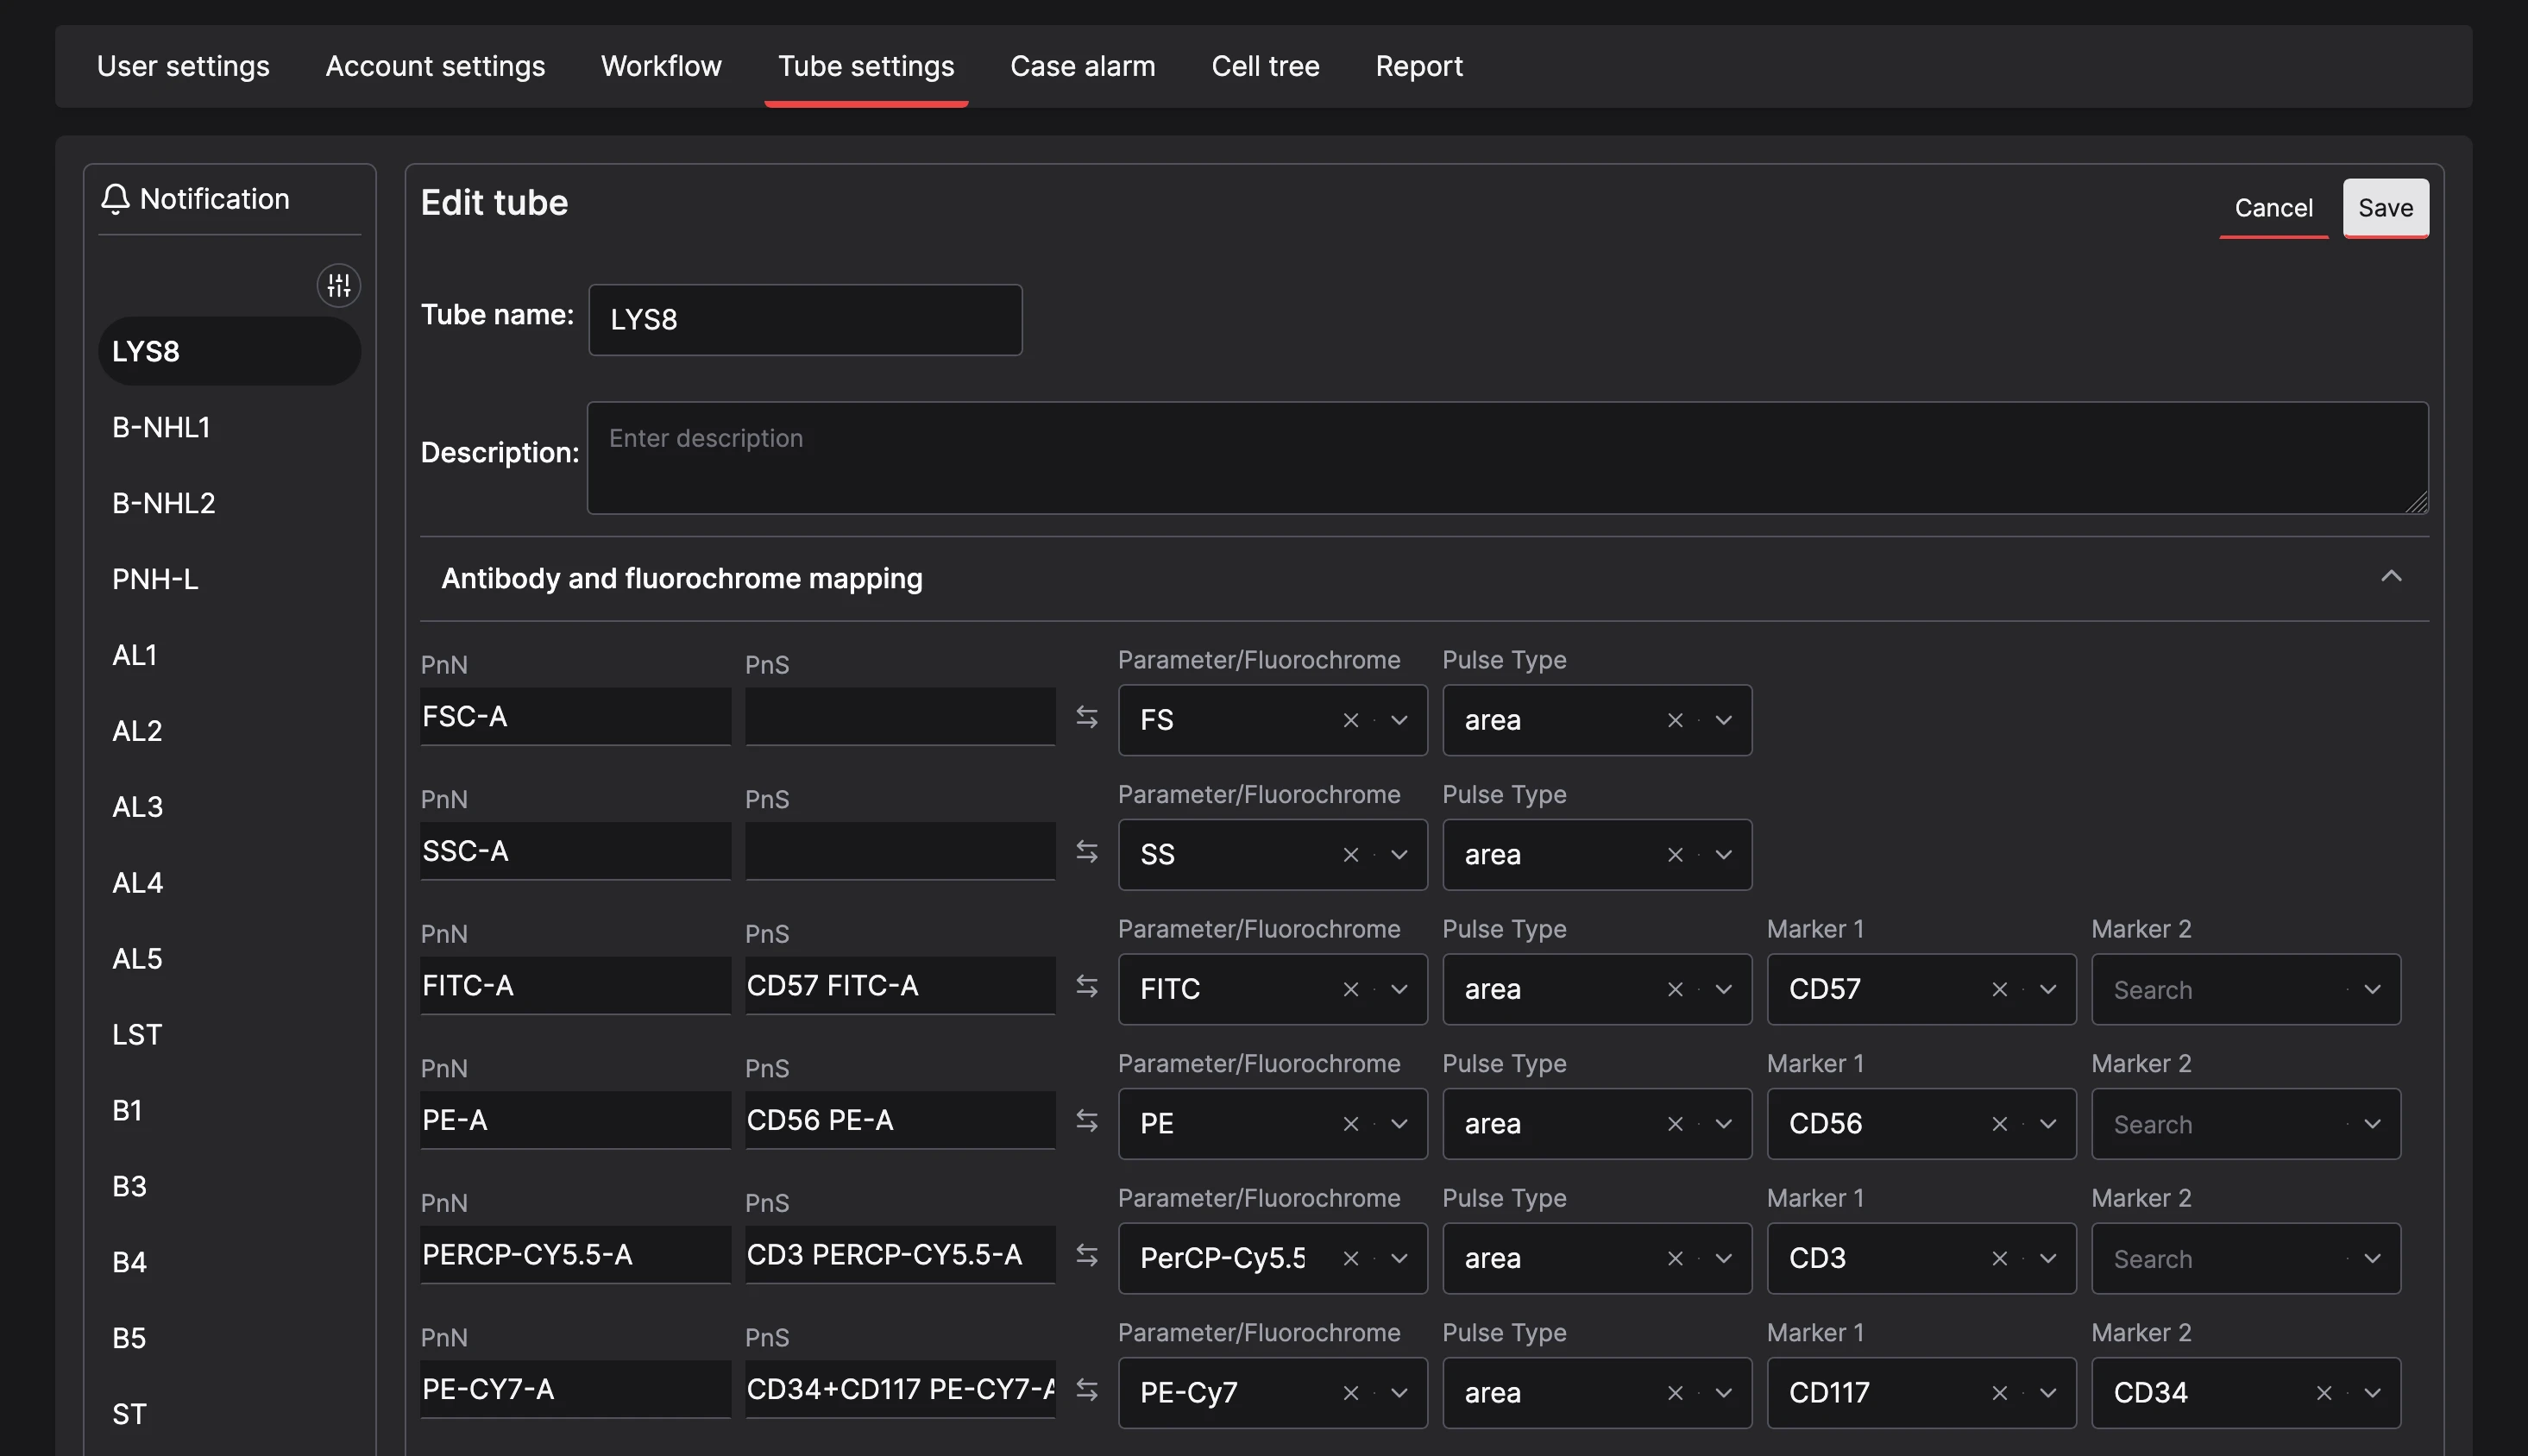
  • CellStudio tube settings mapping flow cytometry parameters, fluorochromes, and markers

    Deep panel configuration

    Configure a template for your panels once and have CellStudio automatically apply marker mappings and Worksheet layouts to all cases.

    CellStudio tube settings mapping flow cytometry parameters, fluorochromes, and markers

Ready for your routine.

Validation scope

  • Consistent across panels and specimen types

    Peripheral blood and bone marrow

  • Expert-level leukocyte differentiation

  • Validated in pathological and non-pathological cases

Read the study

Study at a glance

  • 5 laboratory sites
  • 20,000 patient samples
  • Routine FACS panels
  • Automated AI analysis

What this means for your lab

  • Reproducible cell identification
  • Panel-independent consistency
  • Reduced operator variability

hema.to by the numbers.

Hema.to
Analyses supported by hema.to
4,000+
FCS files in our database
600,000+
Mean accuracy in our prospective interventional clinical study
98.6%
Peer-reviewed publications
4

What our customers and partners say.

I am very excited about implementing the decision support system developed by hema.to into the flow cytometry lab space! It will help streamline and automate analysis workflows leading to improved accuracy and turnaround times.”

Prof. Dr. Pozdnyakova

Director of hematopathology at UPenn Medicine

Partners

Investors

See CellStudio with your own data.

Bring a handful of your own cases and we'll walk through the entire workflow with you, from raw FCS file to finalized report.